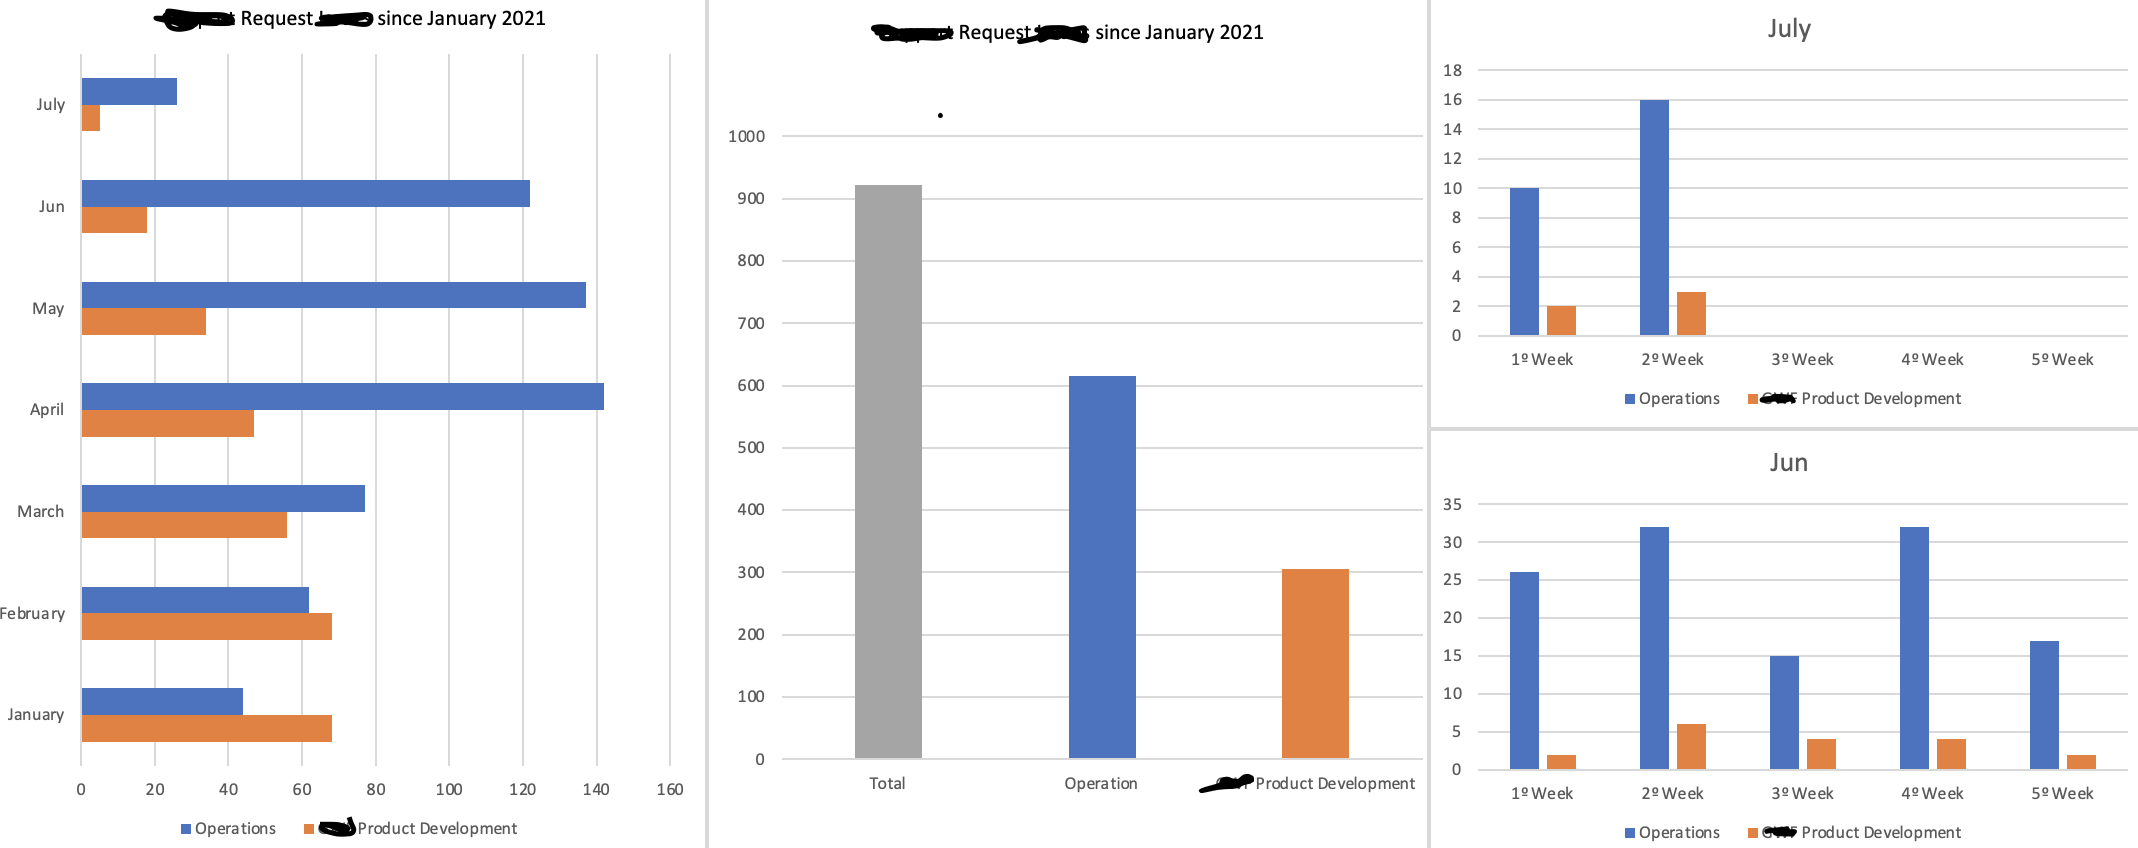
Need to make independent charts for current month, last month and since the beginnig of the year.
Been trying to make the table and then make the bar charts, got so far but cant seem to populate my code in order to build the tables with the specific data from a txt.
been playing arround but cant seem to do this, can someone help?
from tkinter import *
import calendar
import datetime
import numpy as np
import matplotlib.pyplot as plt

from datetime import datetime

datetime_object = datetime.strptime('Jun 1 2005  1:33PM', '%b %d %Y %I:%M%p')

root = Tk()
w, h = root.winfo_screenwidth(), root.winfo_screenheight()
root.geometry("%dx%d+0+0" % (w, h))
root.title("week")

dt = datetime.datetime.today()
cd = calendar.Calendar()


file = open("sample.txt")
data = file.read()

lst_last_month=[]
for tipo, data in data:
    datetime_object = datetime.strptime(data, '%b %d %Y %I:%M%p')
    if startdate <= datetime_object <= enddate:
        lst_last_month.append(data)
        lst_last_month.append(tipo)
This is the expected end result