10 Popular Science APIs

It's a proven fact: scientists and researchers that work in physical science, Earth science, life science, computer science, and any other scientific discipline have benefited from Application Programming Interfaces or APIs. APIs work hand-in-hand with standards and open data to provide scientists efficient ways to conduct, manage, and share research.

HostGator Cloud Web Hosting Review (2019)

If you’re in the market for a new web hosting service, HostGator is certainly an option that will come on your radar. It’s a reputable company within the web hosting industry.

Like most web hosts, HostGator has a wide range of plans, options, and hosting types to accommodate the needs of different websites.

Today, I want to put more emphasis on the HostGator Cloud.

Cloud hosting is new compared to other types of web hosting. Rather than your website being hosted on a local server, it’s hosted on multiple remote servers.

One of the biggest benefits of cloud hosting is the ability to scale on-demand. So it’s a great option for fast-growing websites with high volatility in their site traffic.

For those of you who are interested in using the cloud to host your website, I strongly recommend that you review my analysis of HostGator Cloud. I’ll cover their plans, pricing, benefits, and everything else that you need to know before finalizing your decision.

HostGator Cloud Web Hosting Plans

HostGator Cloud Hosting

There are three cloud plans offered by HostGator. The cloud uses premium hardware, low-density servers, and multiple layers for caching. As a result, this speeds up your page loading times.

As your traffic increases, HostGator Cloud plans make it possible for you to increase your resources with a click on-demand. All of this happens without any downtime, reboots, or data migrations.

Regardless of the plan you choose, you’ll have access to HostGator’s intuitive dashboard. From here, you’ll be able to monitor all of the metrics related to your website’s performance.

That’s what you’ll use to allocate any additional resources accordingly. Basically, you have complete control of your usage with the HostGator Cloud.

Let’s take a closer look at each individual cloud hosting plan.

Hatchling Cloud

The Hatchling Cloud is the entry-level cloud hosting plan from HostGator. It’s made for hosting one domain and has 2 GB of RAM.

Like all cloud plans, the Hatchling comes with a free SSL certificate.

Pricing for this plan starts at $4.95 per month as an introductory offer. Your contract will renew at $8.95 per month.

You can add on SiteLock monitoring, CodeGuard site backups, professional email, and HostGator SEO tools for additional annual fees.

This plan is best for new websites that want to be hosted on the cloud. Even though you can allocate new resources on demand, you’ll likely want to upgrade as your total monthly traffic increases.

Baby Cloud

Here’s a quick glance at what the Baby Cloud offers compared to the Hatchling.

Baby Cloud

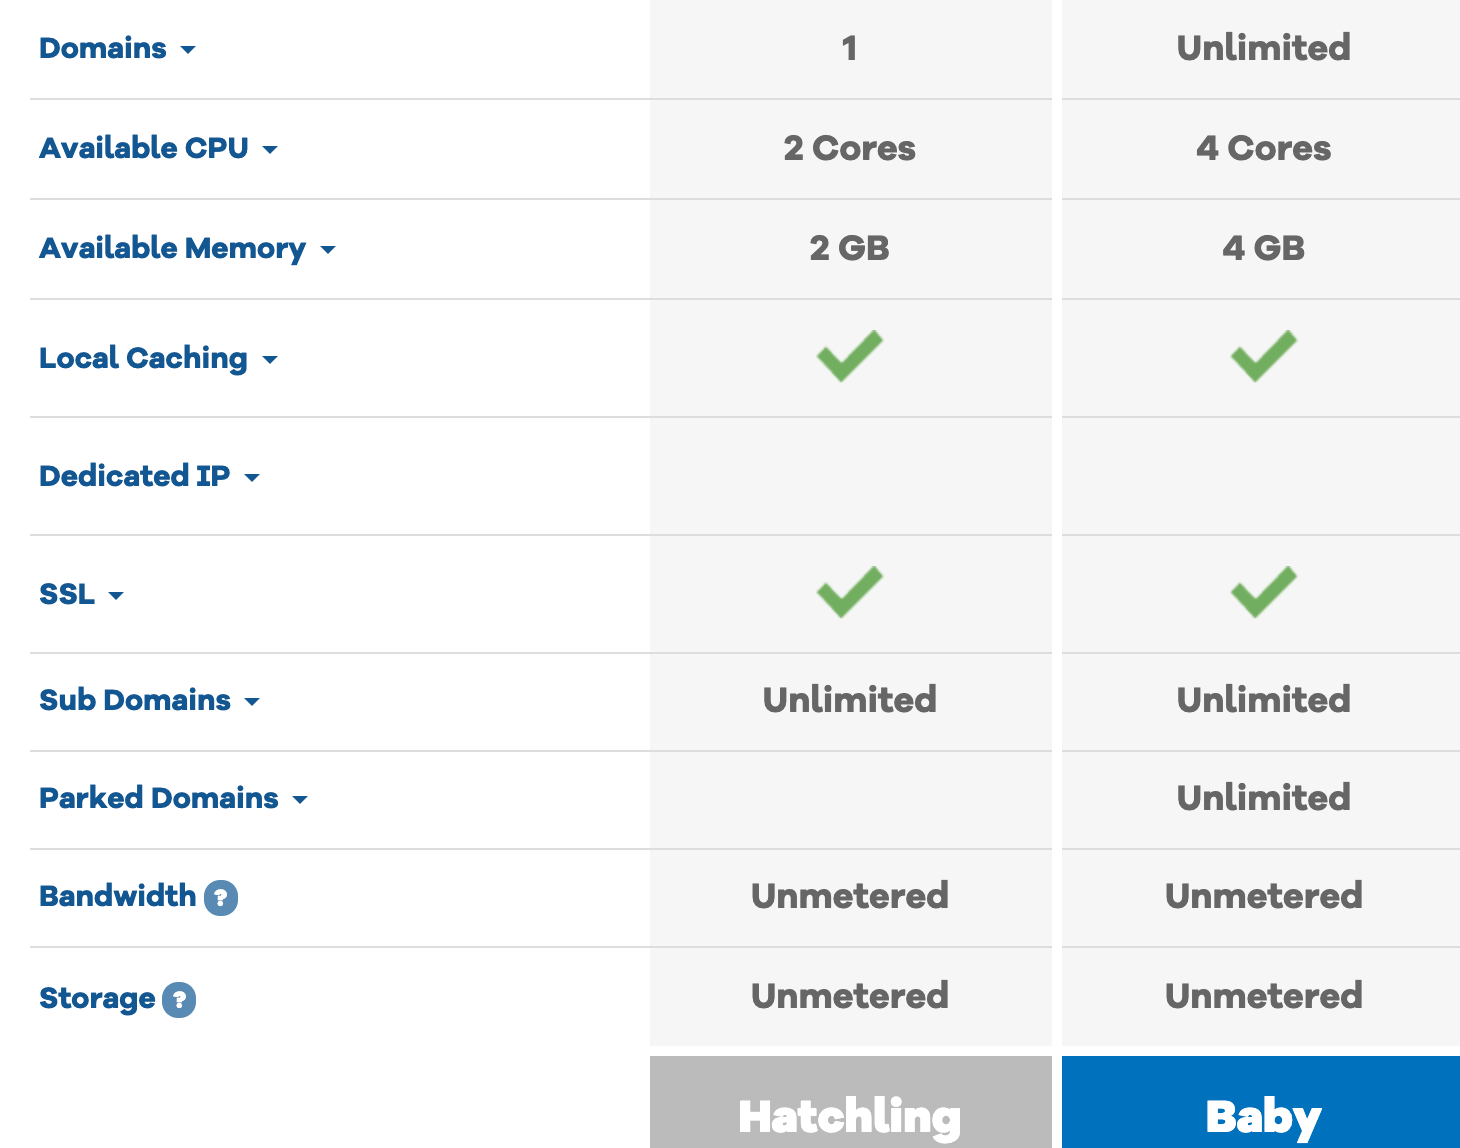
As you can see, the Baby Cloud can host unlimited domains, and has twice as much available CPU space, and double the memory.

The rate for new cloud customers is $7.95 per month, before renewing at $11.95 per month. Right now they’re running a deal where you can actually get the introductory rate reduced down to $6.57 per month, which is a great value.

All you need to do is sign up and the discount will automatically be applied at the checkout.

This is the most popular cloud hosting plan offered by HostGator. I’d say it will likely be the option that’s the most suitable for the majority of you.

Business Cloud

The Business Cloud is HostGator’s top-tier cloud hosting plan. Like the Baby Cloud, it also hosts an unlimited number of domains on a single plan.

However, the Business plan comes with access to 6 cores, as opposed to just 2 or 4 cores on the Hatchling and Baby plans. Your HostGator Business Cloud also has access to 6 GB of RAM.

It’s the only cloud hosting plan that comes standard with a dedicated IP address. This feature is not available on the Hatchling plan and it costs an additional $4 per month on the Baby Cloud plan.

Considering that the Business Cloud starts at $9.95 per month, that extra feature is a great value. However, it’s worth noting that renewals jump up to $17.95 per month once your initial contract expires.

Alternative Hostgator hosting options

While the primary focus of this review is on the HostGator Cloud, I would be doing you a disservice if I didn’t mention the other hosting options offered by this provider.

Cloud hosting isn’t for everyone. So if you’re in the market for a more traditional type of web hosting plan, you may want to consider one of these options as an alternative.

Dedicated server hosting

HostGator Dedicated Server

With a dedicated server, your website will be renting a physical server from HostGator. This server will only be used for your site.

It’s a faster option than shared or VPS hosting since you won’t be sharing any resources, storage, or bandwidth with other websites.

Dedicated servers are ideal for those of you who are a bit more tech-savvy. If you want complete control over your server in terms of security and flexibility, this is your best bet.

Pricing for HostGator dedicated servers starts at:

  • $118.99 per month for the Value Server
  • $138.99 per month for the Power Server
  • $148.98 per month for the Enterprise Server

Compared to the cloud hosting plans, these dedicated servers are priced significantly higher.

VPS hosting

Virtual private servers from HostGator give you flexible software options. You’ll gain full root access, which gives you added control in your environment.

The VPS plans are a step up from shared hosting, but not quite as in-depth or expensive as the dedicated servers. For comparison purposes, let’s take a look at how these VPS plans are priced, so you can weigh them as an option against cloud hosting.

  • Snappy 2000 — $29.95 per month
  • Snappy 4000 — $39.95 per month
  • Snappy 8000 — $49.95 per month

If you’re already using cPannel for web hosting, SiteGround will migrate you to VPS hosting for free.

Shared hosting

If you’re on a budget and don’t want to use the cloud, shared hosting is the bottom-tier plan offered by HostGator.

Plans start at $2.75 per month, $3.95 per month, and $5.95 per month, respectively.

The problem with this option is that you’re going to be sharing resources with other websites. So if those sites have traffic spikes or higher volumes of visitors, it will impact the metrics on your site as well.

So if you want to save some money, but don’t want to sacrifice performance, cloud hosting will be a better option for you. Shared hosting doesn’t give you the flexibility to manage your resources the way that cloud hosting does.

Benefits of HostGator Cloud for web hosting

Now that you’ve had a chance to see some of the other types of web hosting offered by HostGator, let’s get back to focusing on the HostGator Cloud.

The following benefits refer specifically to the cloud plans. So for those of you who are considering one of those alternative options, I can’t guarantee the same advantages.

High uptimes and fast load times

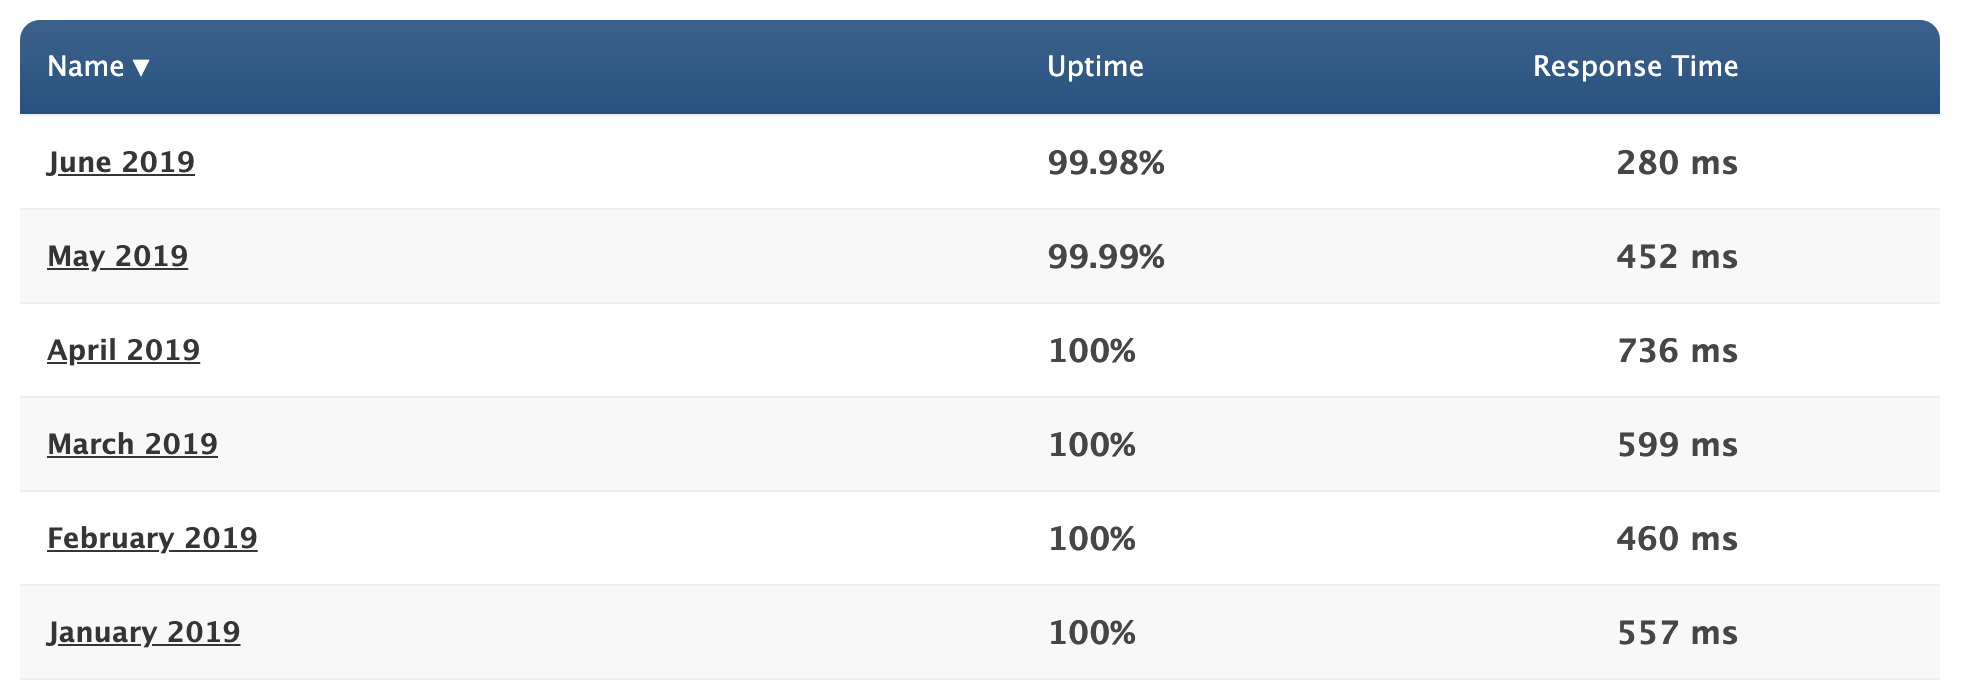
When measuring the performance of a web hosting service, uptime and page loading speeds are two of the most important metrics to consider. Let’s take a look at how a HostGator Cloud test website performed so far this year.

HostGator Uptimes

Over the past six months, HostGator Cloud had a 99.995% average uptime rate. That’s about as exceptional as it gets.

As you can see from the table above, the page loading speed fluctuates quite a bit so far this year. The fastest average monthly response time was 280 ms, while the slowest was 736 ms. But on average, the response time in 2019 is 514 ms.

Truthfully, it’s definitely not the fastest loading time we’ve seen. But with that said, it’s still very fast, and far from the slowest.

Based on these numbers, I can’t say that you’ll be disappointed with your uptimes or loading speed if you decide to go with a cloud hosting plan from HostGator.

User-friendly

HostGator Cloud is very easy to use. It’s a great option for beginners, as well as users who have more experience with web hosting.

The cloud plans make it possible for you to allocate your resources as needed whenever you’re experiencing traffic spikes. That’s not the case with their other plans, which would require you to upgrade as you reached limitations on resources.

Even if you’ve never done this before, the interface is very easy to manage.

Another reason why HostGator Cloud is so user-friendly is because you won’t have to worry about outrageous pricing. These plans don’t surprise you with monthly overage fees when you exceed your plan limits. That’s a major downside of other web hosting plans.

Lots of freebies

The reason why cloud hosting from HostGator is so fast is because it doesn’t rely on typical servers. Instead, the servers from remote data centers work in unison with a person’s web browser to limit the number of resources required to host the website.

Things like managed cloud resources, data mirroring, and integrated caching make this possible, which comes free with your cloud hosting plan.

Furthermore, you’ll get free server monitoring to alert you if there are any hardware problems.

When you sign up for HostGator cloud, you’ll have access to cPannel as well. As I said before, you’ll get a free migration if you’ve been using cPannel with your current web host.

Easy access to customer support

HostGator Cloud comes with 24/7/365 customer support, which is crucial for web hosting. My favorite part about this is their support portal.

Rather than having to pick up the phone or chat online, there’s a good chance you can find the answer to your question here.

Here’s an example of a tutorial that explains the step-by-step process of how to add resources to your cloud hosting plan.

Hostgator Update Plan

HostGator has tons of these for nearly every aspect of cloud hosting. It’s a quick way to find a solution to your problem.

With that said, phone support and live chat is always available as well. Personally, I prefer live chat as opposed to picking up the phone. But you’ll have both options depending on your personal preference.

Other considerations

Based on the benefits that we just discussed, I think we’ve established that HostGator Cloud is a top choice to consider if you want to use cloud hosting. But with that said, there are a couple of things that you need to keep in mind before you make that decision.

I briefly touched on this earlier when we discussed the cloud hosting plans, but the initial rates are just introductory offers. When your contract renews, you’ll be paying more.

Depending on your plan, you can expect prices to increase by roughly 80%.

While HostGator has its fair share of freebies, there are also some upsells along the way as well. Some of these are automatically checked off in your shopping cart, so make sure you review that page thoroughly before you commit to anything.

Conclusion

Overall, HostGator is a reputable name in the web hosting space. Their cloud hosting service is a great option for those of you who want to take advantage of cloud website hosting.

If you compare those plans to their standard shared hosting options, the cloud is the superior choice in my opinion.

However, if you don’t think cloud hosting is for you then you could always consider VPS or dedicated server hosting from HostGator as well.

For those of you who still aren’t convinced on the HostGator Cloud, you can check out my list of the best web hosting services for some other viable options.

Tom’s Tech Notes: How to Innovate Better [Podcast]

Welcome to our latest episode of Tom's Tech Notes! This week, DZone.com's research analyst Tom Smith chats with Dell Boomi CTO Michael Morton about how to innovate better. Learn who to approach about innovating, how to plan for it, and the importance of not just failing fast, but learning and implementing fast.

And, as always, you can find our podcasts on:

The Joys Of July (2019 Wallpapers Edition)

The Joys Of July (2019 Wallpapers Edition)

The Joys Of July (2019 Wallpapers Edition)

Cosima Mielke

A scoop of their favorite ice cream, a bike ride in the summer rain, or listening to the frog concert by the nearby lake — a lot of little things and precious moments have inspired the design community to create a wallpaper this July.

This monthly wallpapers challenge has been going on for more than nine years now, and each time anew, artists and designers from across the globe take it as an occasion to tickle their creativity and cater for beautiful, unique, and thought-provoking wallpaper designs. Wallpapers that are bound to get your ideas sparking, too.

The wallpapers in this collection all come in versions with and without a calendar for July 2019 and can be downloaded for free. A big thank-you to everyone who submitted their designs! At the end of this post, we also compiled some July favorites from past years’ editions that are just too good to be forgotten. Enjoy!

Please note that:

  • All images can be clicked on and lead to the preview of the wallpaper,
  • You can feature your work in our magazine, too. So if you have an idea for an August wallpaper design, please don’t hesitate to submit it. We’d love to see what you’ll come up with.

Further Reading on SmashingMag:

Hello, Strawberry Sundae!

“Is there anything more refreshing (and more delicious!) than a strawberry sundae on a hot summer day? Well, we don’t think so. And did you know that strawberry celebration is on its way in the U.S. Oh, yes! July 7th is the National Strawberry Sundae Day, and we predict that it’s going to be sweet and yummy. So, make your favorite dessert and start preparing yourself for the festive July days.” — Designed by PopArt Studio from Serbia.

Hello, Strawberry Sundae!

Riding In The Drizzle

“Rain has come, showering the existence with new seeds of life… Everywhere life is blooming, as if they were asleep and the falling music of raindrops have awakened them… Feel the drops of rain… Feel this beautiful mystery of life… Listen to its music, melt into it…” — Designed by DMS Software from India.

Riding In The Drizzle

We All Scream For Ice Cream

“There are two things that come to mind when I think about July: ice cream and the Fourth of July!” — Designed by Alyssa Merkel from the United States.

We All Scream For Ice Cream

My July

Designed by Cátia Pereira from Portugal.

My July

Alentejo Plain

“Based on the Alentejo region, south of Portugal, where there are large plains used for growing wheat. It thus represents the extensions of the fields of cultivation and their simplicity. Contrast of the plain with the few trees in the fields. Storks that at this time of year predominate in this region, being part of the Alentejo landscape and mentioned in the singing of Alentejo.” — Designed by José Guerra from Portugal.

Alentejo Plain

Frogs In The Night

“July is coming and the nights are warmer. Frogs look at the moon while they talk about their day.” — Designed by Veronica Valenzuela from Spain.

Frogs In The Night

July Rocks!

Designed by Joana Moreira from Portugal.

July Rocks!

Plastic Bag Free Day

“The objective of this date is to draw attention to the production and over-consumption of plastic bags worldwide, presenting alternatives to solve this serious environmental problem. It is urgent to change the behavior of all human beings regarding the use of plastic bags. For the preservation of the environment, we should use the same plastic bag for shopping, recycling or use paper bags. In this wallpaper I drew a plastic bag with a turtle inside it, as if it was imprisoned by its own bag, as if the ocean was reduced to a plastic bag, emphasizing the seriousness of this environmental problem, which has tortured both turtles and many others marine species.” — Designed by Carolina Santos from Portugal.

Plastic Bag Free Day

Save The Tigers

“Global Tiger Day, often called International Tiger Day, is an annual celebration to raise awareness for tiger conservation, held annually on July 29. It was created in 2010 at the Saint Petersburg Tiger Summit. The goal of the day is to promote a global system for protecting the natural habitats of tigers and to raise public awareness and support for tiger conservation issues.” — Designed by Athulya from Calicut.

Save The Tigers

Palms

“I was inspired by Hawaii type of scenarios with some reference to surf.” — Designed by Sónia Fernandes from Portugal.

Palms

Friendship Day

“The lower part of the image is represented in a more realistic and detailed form and represents the basis of the friendship, conveying a strong connection both in the simplicity and strength of the gestures, hands and medals that both children wear around their necks are symbols of this union. In terms of color I chose to use the ash scale, referring to the old photograph, implying the idea of a long duration of the relations of friendships and the memories we keep of our childhood friends, the illustration represented portrays a memory of mine, which makes it very personal. At the top of the wallpaper, the identity of the two characters appears pixelated, suggesting an idea of building deconstruction, through colored squares that come together and move away, as a symbol of connections and the sharing of emotions, which build and strengthen bonds of friendship.” — Designed by Carolina Santos from Portugal.

Friendship Day

Yellow Lemon Tree

“Summer is here, enjoy it and cool and stay hydrated!” — Designed by Melissa Bogemans from Belgium.

Yellow Lemon Tree

Summer Energy

Designed by IQUADART from Belarus.

Summer Energy

Heat Wave

Designed by Ricardo Gimenes from Sweden.

Heat Wave

Season Of Wind

“Summer is the season of wind. I like to stand on top of the mountains, hearing the song of the wind flying through the meadow.” — Designed by Anh Nguyet Tran from Vietnam.

Season Of Wind

Oldies But Goodies

Let’s go an a journey back in time: Down in our wallpaper archives, we rediscovered some July classics that are just too good to gather dust. May we present… (Please note that these designs don’t come with a calendar.)

Fire Camp

“What’s better than a starry summer night with an (unexpected) friend around a fire camp with some marshmallows? Happy July!” — Designed by Etienne Mansard from the UK.

Fire Camp

Heated Mountains

“Warm summer weather inspired the color palette.” — Designed by Marijana Pivac from Croatia.

Heated Mountains

Tutti Frutti

“July is National Ice Cream Month and who needs an invitation for a scoop or two, or three! Lacking the real thing, our Tutti Frutti wallpaper can satisfy until your next creamy indulgence.” — Designed by Karen Frolo from the United States.

Tutti Frutti

Memories In July

“Words are few, thoughts are deep, memories of you we’ll always keep.” — Designed by Suman Sil from India.

Memories In July

Cactus Hug

Designed by Ilaria Bagnasco from Italy.

Cactus Hug

Keep Moving Forward

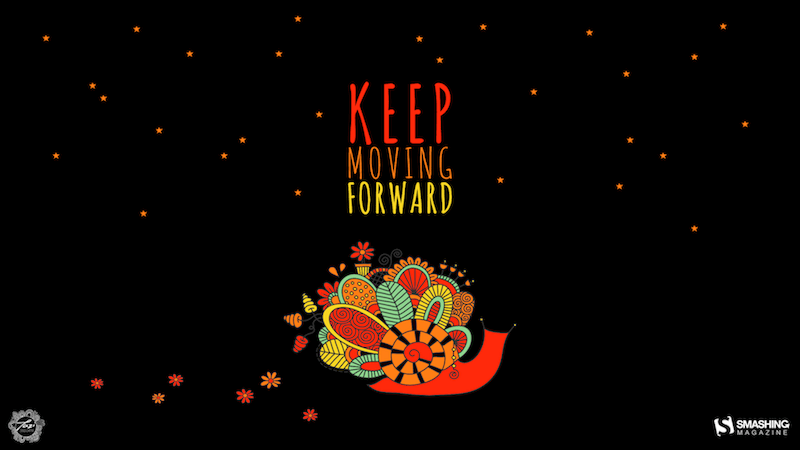
“Snails can be inspiring! If you keep heading towards your goal, even if it is just tiny steps, enjoy the journey and hopefully it will be worth the effort.” — Designed by Glynnis Owen from Australia.

Keep Moving Forward

Sand And Waves

“What do you do in summer? You go to the beach. Even if you can’t go — feel the waves and sand and sun through this funny wallpaper.” — Designed by Olga Lepaeva from Russia.

Sand And Waves

Island River

“Make sure you have a refreshing source of ideas, plans and hopes this July. Especially if you are to escape from urban life for a while.” — Designed by Igor Izhik from Canada.

Island River

Ice Cream vs. Hot Dog

“It’s both ‘National Ice Cream Month’ and ‘National Hot Dog Month’ over in the US, which got me thinking — which is better? With this as your wallpaper, you can ponder the question all month!” — Designed by James Mitchell from the UK.

Ice Cream vs. Hot Dog

Summer Heat

Designed by Xenia Latii from Berlin, Germany.

Summer Heat

Peaceful Memories

“July is one of the most beautiful months of the year. Enjoy every day, every hour, which gives us this month!” — Designed by Nikolay Belikov from Russia.

Peaceful Memories

Floral Thing

“The wallpaper which I created consists of my personal sketches of Polish herbs and flowers and custom typography. I wanted it to be light and simple with a hint of romantic feeling. I hope you’ll enjoy it!” — Designed by Beata Kurek from Poland.

Smashing Desktop Wallpapers - July 2012

An Intrusion Of Cockroaches

“Ever watched Joe’s Apartment when you were a kid? Well that movie left a soft spot in my heart for the little critters. Don’t get me wrong: I won’t invite them over for dinner, but I won’t grab my flip flop and bring the wrath upon them when I see one running in the house. So there you have it… three roaches… bringing the smack down on that pesky human… ZZZZZZZAP!!” — Designed by Wonderland Collective from South Africa.

An Intrusion Of Cockroaches

Celebrate Freedom

“This wallpaper encourages you to appreciate and celebrate the country’s freedom as well as your own!” — Designed by Marina Zhukov from the USA.

Desktop Wallpaper

Hot Air Balloon

Designed by Studcréa from France

Hot Air Balloon

Only One

Designed by Elise Vanoorbeek from Belgium

Only one

Cool Summer

“Even though it is not summer in my country, I made a summer theme. A cool approach to summer themes, tough, very fresh and ‘twilighty’.” — Designed by Marcos Sandrini from Brazil.

Smashing Desktop Wallpapers - July 2012

Birdie Nam Nam

“I have created a pattern that has a summer feeling. For me July and summer is bright color, joy and lots of different flowers and birds. So naturally I incorporated all these elements in a crazy pattern.” — Designed by Lina Karlsson, Idadesign Ab from Sweden.

Smashing Desktop Wallpapers - July 2012

Sun In July

”…enjoy the sun in July!” — Designed by Marco Palma from Italy/Germany.

Smashing Desktop Wallpapers - July 2012

Join In Next Month!

Please note that we respect and carefully consider the ideas and motivation behind each and every artist’s work. This is why we give all artists the full freedom to explore their creativity and express emotions and experience throughout their works. This is also why the themes of the wallpapers weren’t anyhow influenced by us but rather designed from scratch by the artists themselves.

Thank you to all designers for their participation. Join in next month!

Smashing Editorial (il)

3 Design Strategies That Won’t Work in the Next 3 Years

Web design strategies change continuously. The attraction of the older strategies fades away and the traction of newer strategies of web designing increases. The web development industry continuously adapts to changes in strategies to create a better user experience and raise the bar for businesses to come. The fast changes in strategies pose different types […]

The post 3 Design Strategies That Won’t Work in the Next 3 Years appeared first on designrfix.com.

Free Online JavaScript for WordPress Conference to Feature “Headless WordPress” Track, July 12

The second edition of the JavaScript for WordPress conference will be streamed online July 11-13, 2019. Based on the success of the 2018 event, which had 1,200 attendees watching live, organizer Zac Gordon decided to expand the event to feature three free days of talks, workshops, and a contribution day focused on JavaScript and WordPress.

The conference will run from July 11-13, and includes educational content for a whole range of Javascript capabilities, from beginner to advanced:

  • Day 1 – Workshops for JavaScript Beginners
  • Day 2 – Three Tracks of Intermediate and Advanced Talks (plus One Non-Technical Track)
  • Day 3 – Contributor Day to help improve the JavaScript-related documentation for WordPress

Gordon has published the finalized schedule for the 36 sessions and speakers that will be streamed on Friday, July 12. This year the event will feature one track devoted to exploring topics surrounding “headless WordPress,” an approach that eschews WordPress’ traditional architecture in favor of decoupling the front and backends, allowing developers to integrate different stacks. The track includes presentations like A React Theme in 30 Min, SEO for Headless WordPress Themes, Gatsby & WordPress, and Headless E-Commerce with BigCommerce. Other tracks feature more general JavaScript and Gutenberg topics.

Thanks to more than a dozen sponsors, registration is free, but viewers must sign up on the conference website in order to attend online.

The (Developer’s) Growth Model

I really like the post "The Designer’s Growth Model" by Dennis Hambeukers. Dennis just invented this model, but it's based on some existing ideas and it all rings true for me. Let me try to summarize the five stages as he lays them out for designers.

  1. Producers: You learn how to design. You learn fundamentals, you practice, you get good at doing design work and producing beautiful functional things. Then you have this "crisis" moment before the next stage where you find you can't do enough work on your own and that you need to be able to scale your efforts, with multiple human beings and working on systems — and that's an entirely new skill.
  2. Architects: Now that you've succeeded in scaling through team building and systems thinking, the next crisis moment is that that this the work still might be isolated, and too focused on internal thinking. To grow, you'll need to work with people outside the design bubble, and understand problems more holistically.
  3. Connectors: Now that you've succeeded in being more collaborative across an entire organization and being a real problem solver, the next crisis moment is when everything becomes organizationally complicated. Just delivering products isn't enough, because you're involved deeply across the organization and you're responsible for the success of what is delivered.
  4. Scientists: Now, you measure everything. You know what works and what doesn't because you test it and can prove it, along with using all the skills you've honed along the way. Your next crisis is figuring out how to translate your work into actual change.
  5. Visionaries: You're a leader now. You have an understanding of how the whole organization ticks, and you are a force for change.
From The Designer's Growth Model

I think this can applies just as well to web development, with very little change. I can relate in many ways. I started plucking away at building sites alone. I found more success and was able to build bigger things by working with other people. At some point, it was clear to me that things don't revolve around development. Development is merely one part of a car that doesn't drive at all without many other parts. Even today, it's clearer to me that I can be more effective and drive more positive change the more I know about all of the parts.

Not that I've completed my journey. If I had to map myself directly onto this model, I'm probably barely on step three — But a model is just a model. It's not meant to be a perfect roadmap for everybody. Your own career path will be twistier than this. You might even experience bits from all the levels in different doses along the way.

The post The (Developer’s) Growth Model appeared first on CSS-Tricks.

GIPHY Announces Platform Enhancements and New SDK

GIPHY, the provider of a database and search engine for animated GIFs, has announced a new SDK that provides third-parties access to GIFs, stickers, and additional new content like GIPHY Emoji and Text. With this release, the company hopes to accelerate integration for third-party app developers.

Data Gathering In The Wild: A Hands-On Example

Introduction

This tutorial provides guidance on gathering data through web-scraping. However, to demonstrate the real-life issues with acquiring data, a deep-dive into a specific, complicated example is needed. The problem chosen, acquiring the geographic coordinates of gas stations in a region, turns into an interesting math problem that, eventually, involves "sacred geometry".

Application Programming Interfaces (API's)

No matter which Data Science Process model you subscribe to, actually acquiring data to work with is necessary. By far the most straightforward data source is a simple click-to-download in a standardized file format so you can utilize a parsing module in your favorite language; for example, using Pythons pandas.DataFrame.from_csv() function parses a .csv into a DataFrame object in one line .

Unfortunately, its not always this easy. Real-time data, like the stream of 6000 tweets per second, cant simply be appended to an infinitely-growing file for downloading. Furthermore, what happens when the dataset is extremely large? Smaller organizations might not be able to provide several-gigabyte downloads to each user, and if someone only needs a small subset, then giving them everything would be inefficient.

In general, these problems are solved through an Application Programming Interface (API). APIs are a programmers way of interfacing with an application, or in the context of this article, the means by which we will acquire data. Here's a great, concise resource on why APIs are needed .

One quick note. APIs are typically different from one another, so its not necessary to learn every detail, and are you not expected to. Youll gain experience by using them.

To see how data gathering can look in practice, this article will demonstrate a hands-on approach to find and deal with an API Ive never used before.

Find the Data Source

Before any searching, specify your intentions. For our case, the goal is to get the location, latitude and longitude, of gas stations in the United States in a Python pandas.DataFrame. Notably, it took some googling life hacks to find a free, comprehensive source that meets our requirements. Its a little old, but myGasFeed.com has the data were looking for.

myGasFeed was an API a developer would use to get the local gas prices of an area for a website, mobile app, etc.

Read Rules & Guidelines

Anytime you acquire data programmatically, look for any rules somewhere on the website. They might require you to register for an access key, limit requests, cite them, or follow some uncommon procedure for access. As a data-seeker, you should read pay attention to guidelines for practical, ethical, and potentially legal reasons. Often, the practical part is a tutorial for accessing the data.

In myGasFeeds about page, they describe its features and technology, but also inform that the data is freely accessible through their API. It also refers you to the API section that has directions on how to use a generic API key to access the data.

Hands-on Data Acquisition

Start Small, Then Scale

We need to write a program that interfaces with the myGasFeed application, that is, we need to use its API. In myGasFeed's API requests directions, they provide a developer API key to use outside of a production environment. There's also a template URL to request all the gas stations in a certain radius, centered at a specified latitude/longitude. The response will be in JSON format.

Our program must generate the URL for a query, make a request for the data at that URL, then parse the response into a pandas.DataFrame.

First, a function to generate the URL requires a starting location, query radius, type of fuel, sorting criterion, and the API key. New Orleans, Louisiana will be our first example, but you can use any U.S. location you'd like. Just be sure that you put negatives in front of latitude if given in degrees South, and longitude if given in degrees West.

def make_url(lat, long, distance, fuel_type, sort_by, key="rfej9napna"):
    url = "http://devapi.mygasfeed.com/"
    url += "stations/radius/%s/%s/%s/%s/%s/%s.json?callback=?"%(lat, long, distance, 
                                                                fuel_type, sort_by, key)
    return url

nola = (29.9511, -90.0715)
gas_stations_url = make_url(*nola, 40, "reg", "price")

The content of the gas_stations_url is the string
'http://devapi.mygasfeed.com/stations/radius/29.9511/-90.0715/40/reg/price/rfej9napna.json?callback=?'
and represents the URL to request all gas station data within 40 miles of the center of New Orleans. Note that "reg" corresponds to regular gas, "price" means the gas stations are sorted by price, and the requested radius must be less than 50 miles.

Next, we have to actually request the data using the well-named "requests" module. With it, we can send a "GET" request to a specified URL with the requests.get function. The myGasFeed API allows for GET requests, so it knows how to send data back to our variable.

import requests

response = requests.get(gas_stations_url, 
                        headers={"user-agent":"Jeffrey Lemoine, jeffmlife@gmail.com"})

Notice that the headers parameter has my name and email. This is not necessary but is good practice; for someone checking for malpractice, a name and email might convince them you're not a bot.

The response variable is a requests.models.Response object. The data we requested is in the text attribute. Let's check by printing the first 100 characters in the response text.

print(response.text[0:100])

prints

 '?({"status":{"error":"NO","code":200,"description":"none","message":"Request ok"},"geoLocation":{"country_short":null,"lat":"29.9511","lng":"-90.0715","country_long":null,"region_short":null,"region_long":null,"city_long":null,"address":null},"stations":[{"country":"United States","zip":"70458","reg_price":"N\\/A","mid_price":"N\\/A","pre_price":"N\\/A","diesel_price":"3.85","reg_date":"7 years ago","mid_date":"7 years ago","pre_date":"7 years ago","diesel_date":"7 years ago","address":"3898 Pontch'

Though messy-looking, it appears we received a valid response since there were no error codes and the request is said to be "ok." However, the JSON response is wrapped between '?( and )'. This can be solved with a short function to parse responses into a valid JSON string.

import json 
def parse_response(response):
    # get text 
    response = response.text

    # clean response text
    # initial response is wrapped in '?(...)'
    response = response[2:][:-1]

    # make json 
    data = json.loads(response)["stations"]

    return data

json_data = parse_response(response)

json.loads requires the JSON standard, so trimming the response is necessary to prevent a JSONDecodeError. Since we are interested in gas station locations, only the "stations" values of our response are required. The return type of parse_response is a list of same-keyed dict's. For example, a random element in json_data has the dict

    {'address': '1701 Highway 59',
     'city': None,
     'country': 'United States',
     'diesel': '1',
     'diesel_date': '7 years ago',
     'diesel_price': 'N/A',
     'distance': '29.2 miles',
     'id': '73100',
     'lat': '30.374134',
     'lng': '-90.054672',
     'mid_date': '7 years ago',
     'mid_price': '3.49',
     'pre_date': '7 years ago',
     'pre_price': '3.61',
     'reg_date': '7 years ago',
     'reg_price': '3.29',
     'region': 'Louisiana',
     'station': None,
     'zip': '70448'}

Everything checks out (except that the data is outdated 7 years).

Thankfully, a list of dicts can be transformed into a DataFrame in one line, but some more processing is required.

from pandas import DataFrame, to_numeric

gas_stations = DataFrame(json_data)[["lat","lng"]]
gas_stations.columns = ["lat","lon"]
gas_stations["lon"] = to_numeric(gas_stations["lon"])
gas_stations["lat"] = to_numeric(gas_stations["lat"])

In that same line, only latitude and longitude columns were included. Then, the columns were renamed because I don't like "lng" as a shorthand for longitude. The coordinate values were converted from strings to numbers. The final DataFrame looks like:

Screen_Shot_2019-06-26_at_3_57_34_PM.png

and has 465 rows.

Voil! We now have the geological coordinates of gas stations within 40 miles of the center of New Orleans. But wait, we only used a 40-mile radius and are limited by 50 miles, what if you wanted more? The next section will take our small example and scale it to any radius.

A Nave Solution

Here's our problem: we can only request locations less than 50 miles from a specified center in a single query but want locations more than 50 miles away. We also want to minimize queries to be respectful to myGasFeed.com, and because we programmers strive for optimal code. I figured that we should choose different centers such that there is minimal overlap between radii but still encompass all space. Since we're dealing with circles it's impossible to avoid some overlap, but we can try to minimize it.

Let's use Denver, Colorado as our new center and draw a circle with a 49-mile radius around it.

denver-1.png

Our previous code can already find all the gas stations within that radius. Next, we will figure out a way of generating centers that increase coverage. The nave, but simplest, approach is to expand the centers outward in a gridlike fashion. The distance between centers can be the circle radius (49 miles) times the Euclidean distance on a grid. Each of those centers is a separate query to myGasFeed, so the data will need to be consolidated.

Now, let's write the function to generate the nave grid before we make things more complicated. The procedure is simple. First, make an n x n grid. Then, for each square in the grid (there will be n^2 of them) calculate how far it is from the origin, as well as its angle with respect to True north. With a starting coordinate (Denver) and the distance and direction of a grid point, we can calculate where on Earth that point would be.

from numpy import *
from numpy.linalg import det 
from itertools import product 
from geopy.distance import geodesic, Point

def angle_between(v1, v2):
    """Calculates angle b/w v1 and v2 in degrees"""

    # dot product ~ cos()
    dot_product = dot(v1, v2)     
    # determinant ~ sin()
    determinant = det([v1, v2])    

    # tan = sin()/cos() ==>  = arctan(sin()/cos())
    angle_radians = arctan2(determinant, dot_product)  

    # Convert to degrees in [0,360)
    return (angle_radians * (180 / pi)  + 360) % 360

def expand(center, radius, n_radii):

    # Define starting point
    start = Point(*center)

    # Generate square grid of shape (n_radii x n_radii)
    rng = arange(start = -n_radii, 
                 stop = n_radii + 1, 
                 step = 1, 
                 dtype = float64)
    grid = list(product(rng, rng))  

    # Remove center square [0,0]; no calc. required
    grid.remove(grid[len(grid)//2])

    # Reference direction 
    true_north = array([0,1], dtype=float64)

    new_centers = [center]
    for square in grid:
        # Calculate clockwise angle of square center wrt.
        # true North in degrees [0,360)
        bearing = angle_between(square, true_north)

        # Calculate distance to travel 
        euclidean = lambda p1, p2: sqrt(sum((p1-p2)**2))
        dist = radius * euclidean(square, array([0,0]))

        # Find coord. of point *dist* miles away at *bearing* degrees
        # Using geodesic ensures proper lat, long conversion on ellipsoid
        lat, long, _ = geodesic(miles = dist).destination(point=start, bearing=bearing)
        new_centers.append((lat, long))

    return new_centers

points = expand(denver, 49, 1)

Admittedly, my first version of expand code could only expand once to produce a center at every 45, or a 3 x 3 lattice of points. When attempting to expand to additional radii, calculating the angle with respect to true north (i.e., the bearing) had to be generalized, which is what angle_between addresses; if you're interested in how angle_between works, check out its linear algebra here.

As for the details of expand, it's sufficient to read its comments for an understanding. Long story short, points contains a 3 x 3 nave grid of coordinates centered at Denver, scaled by 49 miles. If we plot these coordinates with their respective circles, we can see substantial overlap.

denver3x3.png

While the nave grid indisputably achieves more-than-full coverage of the area, it's visually apparent that the grid is too tightly-spaced. Thus, there should be a number we can multiply the grid space with to maximally separate the circles without missing any space. But which number?

The Optimal Grid

The solution for how to best distance the grid points for minimally sufficient circle overlap was surprisingly quite simple. Notice that within the center circle of the nave 3x3 grid image (above) there was a square. Its diagonal is equal to the diameter of the circle; therefore, it's the largest possible square that can fit inside a circle with that radius. Interestingly, when I put the squares inside the other circles, even they overlapped inside the nave grid.

We can visualize the inner square overlap through the following color scheme: green for no overlap, yellow for two squares, and red for four squares.

naive-overlap.png

What happens if we were to minimize the overlap between maximal squares such that all inner space is still covered? It would just be a grid of squares and, under our previous visualization, they'd all be green squares. Most importantly, it turns out that organizing circles in a grid according to their maximal inner square is the optimal grid for minimizing circle overlap (and maintaining full coverage).

I will now informally prove this. Imagine a grid of squares. At each corner, there are four squares surrounding it making a cross. If you were to nudge the bottom left (blue) square towards the center (red arrow), additional overlapping occurs; if you were to move the square away from the center (green arrow), then you'd lose full coverage.

proof.png

While it's hard to see, moving the blue square away from the center really would lose coverage. To grasp this, look at the black line between the blue and the orange circle. There is only a single point, at the center of the grid on their square's diagonal, in which they touch this line. This is equally true for the rest of the circles. Therefore, any movement away from the circle would not be full coverage.

Even more, this logic applies to the whole grid because traveling along the green arrow for one center, is a red arrow at another (except for the edges).

Implementing the Solution

To actually implement the optimal grid, all we need to do is find the scaling factor for our grid space. Recall that the nave grid's number, the circle's radius, was too small. Also, we already know the radius of the circle. We are missing the maximal square's dimension, x, which we've shown is the scaling factor we require.

math.png

The optimal grid's scaling factor is the square root of two (~1.414) times the radius of the circle. It separates our grid space such that the circles of that radius have their maximal squares lined up, and their overlap minimized.

All we have to do to our original expand function is multiply the distance to travel by the square root of two:

...
dist = euclidean(square, array([0,0])) * radius * sqrt(2)
...

Now, a single expansion looks like:
denver-3x3-optimal.png

The Final Scrape

The expand function only generates coordinate centers that we need to query. A new function is required that can query all the new points. Although, this time we need a way to deal with failed requests, as well as the rate at which we request.

The procedure is as follows. First, generate the list of URL's to process from the points returned from expand, and put them in the list to track whether or not they've been processed. When that list is empty, return the responses. All that "process" means is to use our earlier function, parse_response, and store its result.

from time import sleep 

def query(points):
    # List of URL's that need to be processed
    to_process = [make_url(*point, 49, "reg","price") for point in points]

    # Current url to process 
    url = to_process.pop()

    data = {}
    while(to_process) :     
        response = requests.get(url, 
                                headers={"user-agent":"Jeffrey Lemoine, jeffmlife@gmail.com"})

        # try to parse, except when bad response
        try: 
            json_data = parse_response(response)
        except (json.JSONDecodeError):
            # Push failed url to front 
            to_process = [url] + to_process
            continue 
        finally: 
             url = to_process.pop() 

            # Limit requests to one per sec.
            sleep(1)

        print("\r%d left to process"%(len(to_process)), end="")
        data[url] = json_data

    return data 

json_data = query(points)

Inside the while loop, there is a try-catch-finally statement that ensures proper handling of a bad request; if there is a bad request, the response is not our JSON data, so it would throw a json.JSONDecodeError when trying to parse it. When a request fails, we don't want the loop to iterate and try that same URL over and over again, so we push the failed URL to the front of to_process. Finally, (that is, after either a successful or a failed request) pop the end of to_process, and sleep one second so that we are respectful to the server.

And, with just a little more processing...

from itertools import chain

stations_list = list(chain.from_iterable(json_data.values()))

gas_stations = pandas.DataFrame(stations_list)[["lat","lng"]]
gas_stations.columns = ["lat","lon"]
gas_stations["lon"] = to_numeric(gas_stations["lon"])
gas_stations["lat"] = to_numeric(gas_stations["lat"])
gas_stations = gas_stations.drop_duplicates().dropna()
gas_stations.index = range(len(gas_stations))

We are back to a DataFrame with our data in the proper numerical types. Since the circle's we generated had overlap, a drop_duplicatescall is necessary to get unique data points.

Conclusion

The experience gained from this procedure is important to highlight. Not all data acquisition is as straightforward as a click-to-download, or as convoluted as the type seen in this article. Often, you are not given instructions on how to do get the data you need in the format you need it, so some hacking is required to meet your needs. On the other hand, you should ask around, or email a data provider, before you spend hours trying to get an API to work the way you'd like; there might already be a way, so don't "reinvent the wheel" unless you have to (or unless you're writing a tutorial on gathering data).

Notes

It turns out that the problem we formulated, minimizing overlap between a grid of circles, is already an artistic concept (specifically in "sacred geometry"), with its own Wikipedia page. Furthermore, I should emphasize that the optimal solution we found is only for a square lattice. There are other constructions with different grids. For example, a triangular grid with 19 circles :

Flower_of_life_0577-19-circle_svg.png

I encourage you to figure out what the optimal configuration of circles with any underlying grid space (I actually don't know yet), and see if you can code it up.

If you like the images I generated, I used plotly's mapbox for plotting points on a map, and Lucidchart for drawing on them.

In Case You Missed It – Issue 27

In Case You Missed It Featured Image
photo credit: Night Moves(license)

There’s a lot of great WordPress content published in the community but not all of it is featured on the Tavern. This post is an assortment of items related to WordPress that caught my eye but didn’t make it into a full post.

Carol Gann Awarded the 2019 Kim Parsell Memorial Scholarship

Carol Gann, who is a Meetup coordinator in the WordPress Orlando Community, has been awarded the Kim Parsell Memorial Scholarship. The scholarship is named after Kim Parsell who passed away in 2015 but her impact on the WordPress community is still felt today.

“My proudest contribution to the WordPress open source project is training small business owners and bloggers to be comfortable and conversant with their own WordPress websites. WordPress empowers people. Many end users of WordPress are not technically minded. As a WordPress Meetup co-organizer, I contribute to the coffee help desk, assisting others in finding solutions to their WordPress problems. I also host another help desk opportunity, ‘Coffee With Carol,’ to empower WordPress users,” Gann said.

I can tell from the quote above that Kim and Carol would get along well as Kim was also the type of person who would do what she could to help others.

GravityView Diversity Grant to Attend PressNomics 6

The folks over at GravityView are offering a grant to recognize the challenges certain groups of people face succeeding in technology fields and to promote inclusivity and diversity. The grant includes a ticket to PressNomics 6, a flight to Tuscon, AZ, lodging, transportation via a Lyft gift card, and a one-on-one business consultation with Zak Katz, Co-founder of GravityView. The deadline to apply is 11:59 PM MDT on June 30, 2019.

10up OpenSource Project Scaffolding Suite

10up has released a project scaffolding suite that includes a WordPress starter theme, starter plugin, and NPM package. The purpose of the suite is to streamline repetitive tasks, encourage community contributions, and provide a starting point that includes 10up’s engineering best practices.

End to End Tests Added to Core

Introducing the WordPress e2e tests

WP Tavern Turns 10 Years Old

I was looking back through the Tavern archives and realized that this past January, WP Tavern turned 10 years old. It’s been quite a journey and it’s not over yet. Check out the first post I published on the Tavern announcing its opening.

Matt Mullenweg Announces That Automattic Is Sponsoring Jill Binder’s Work

Diversifying WordPress

John James Jacoby Releases A Plugin That Cryptographically Signs Posts

John James Jacoby has released a small plugin on GitHub that cryptographically signs posts. The plugin splits the content of posts in words and then stenographically inserts zero-width characters between them. These characters then form a unique, invisible pattern that can be used to detect plagiarised content. This plugin sounds like it would pair well with WordProof.

What does DXP Mean?

I asked on Twitter what does DXP or Digital Xperience platform mean? It comes across as fancy marketing lingo. Here are a few of the responses I received.

Matt Mederios – ‘DXP’ or in other words, how we want our customers to experience WordPress in our controlled ecosystem. All your solutions in one place, possibly to the point you don’t recognize it’s WordPress.

Stephen CroninDXP is an enterprise thing and has been around for ages in various guises. WordPress is not listed by Gartner, but Drupal and SharePoint are, along with other enterprise CMS’s. If people want to create DXPs out of WordPress, more power to them.

Karim MarucchiForget the buzz, large sites are moving past ‘just’ content, no one product (not #AEM not #Sitecore) will ever be perfect for all the existing & new features that are popping up ‘monthly’, so with #OpenSourse we all can make the most open easy/most compatible /cheap framework that will help the #enterprise manage/customize/blend all the ways you need to interact with your clients. And yes, the good Hosts, are staying out of trying to be all things.

Thanks to these three, the meaning of DXP is a bit more clear.

WordCamp EU Organizing Team Issues Apology

There were some things that took place during the WordCamp EU afterparty that didn’t sit well with some people. The WordCamp EU organizing team explained what happened and issued an apology for the mistakes that were made.

Torque Interviews Marcel Bootsman

Doc Pop of Torque caught up with Marcel Bootsman to talk about his walking journey to Berlin. Ironically, the interview occurs as they’re walking around.

That’s it for issue twenty-seven. If you recently discovered a cool resource or post related to WordPress, please share it with us in the comments.

Middle Managers, the Flow of Ideas, and Innovation

It really does take a village, not just upper management.

Few people in an organization have been the focus of so much attention in innovation circles as middle managers. Depending on your point of view, they are seen as either an essential conduit by which information flows, or a barrier to the spread of ideas and knowledge.

Indeed, it’s a topic I myself touched upon when I looked at some new research from Wharton’s Ethan Mollick on the topic. Mollick suggested that middle managers are especially important in industries that require innovative employees such as biotech, computing, and media.

Hierarchy = The Matrix: We Don’t See or Question It

The Matrix is real, my friends.

The hierarchy is at the very center of our lives. We have experienced it in our school years and later when working in organizations. It’s existence and function is tacit in our understanding of reality.

At the Agile Alliance Change Agents workshop, it became clear to me that the existence of hierarchy was greatly influencing the sessions. I sensed that there were two broad themes that emerged: