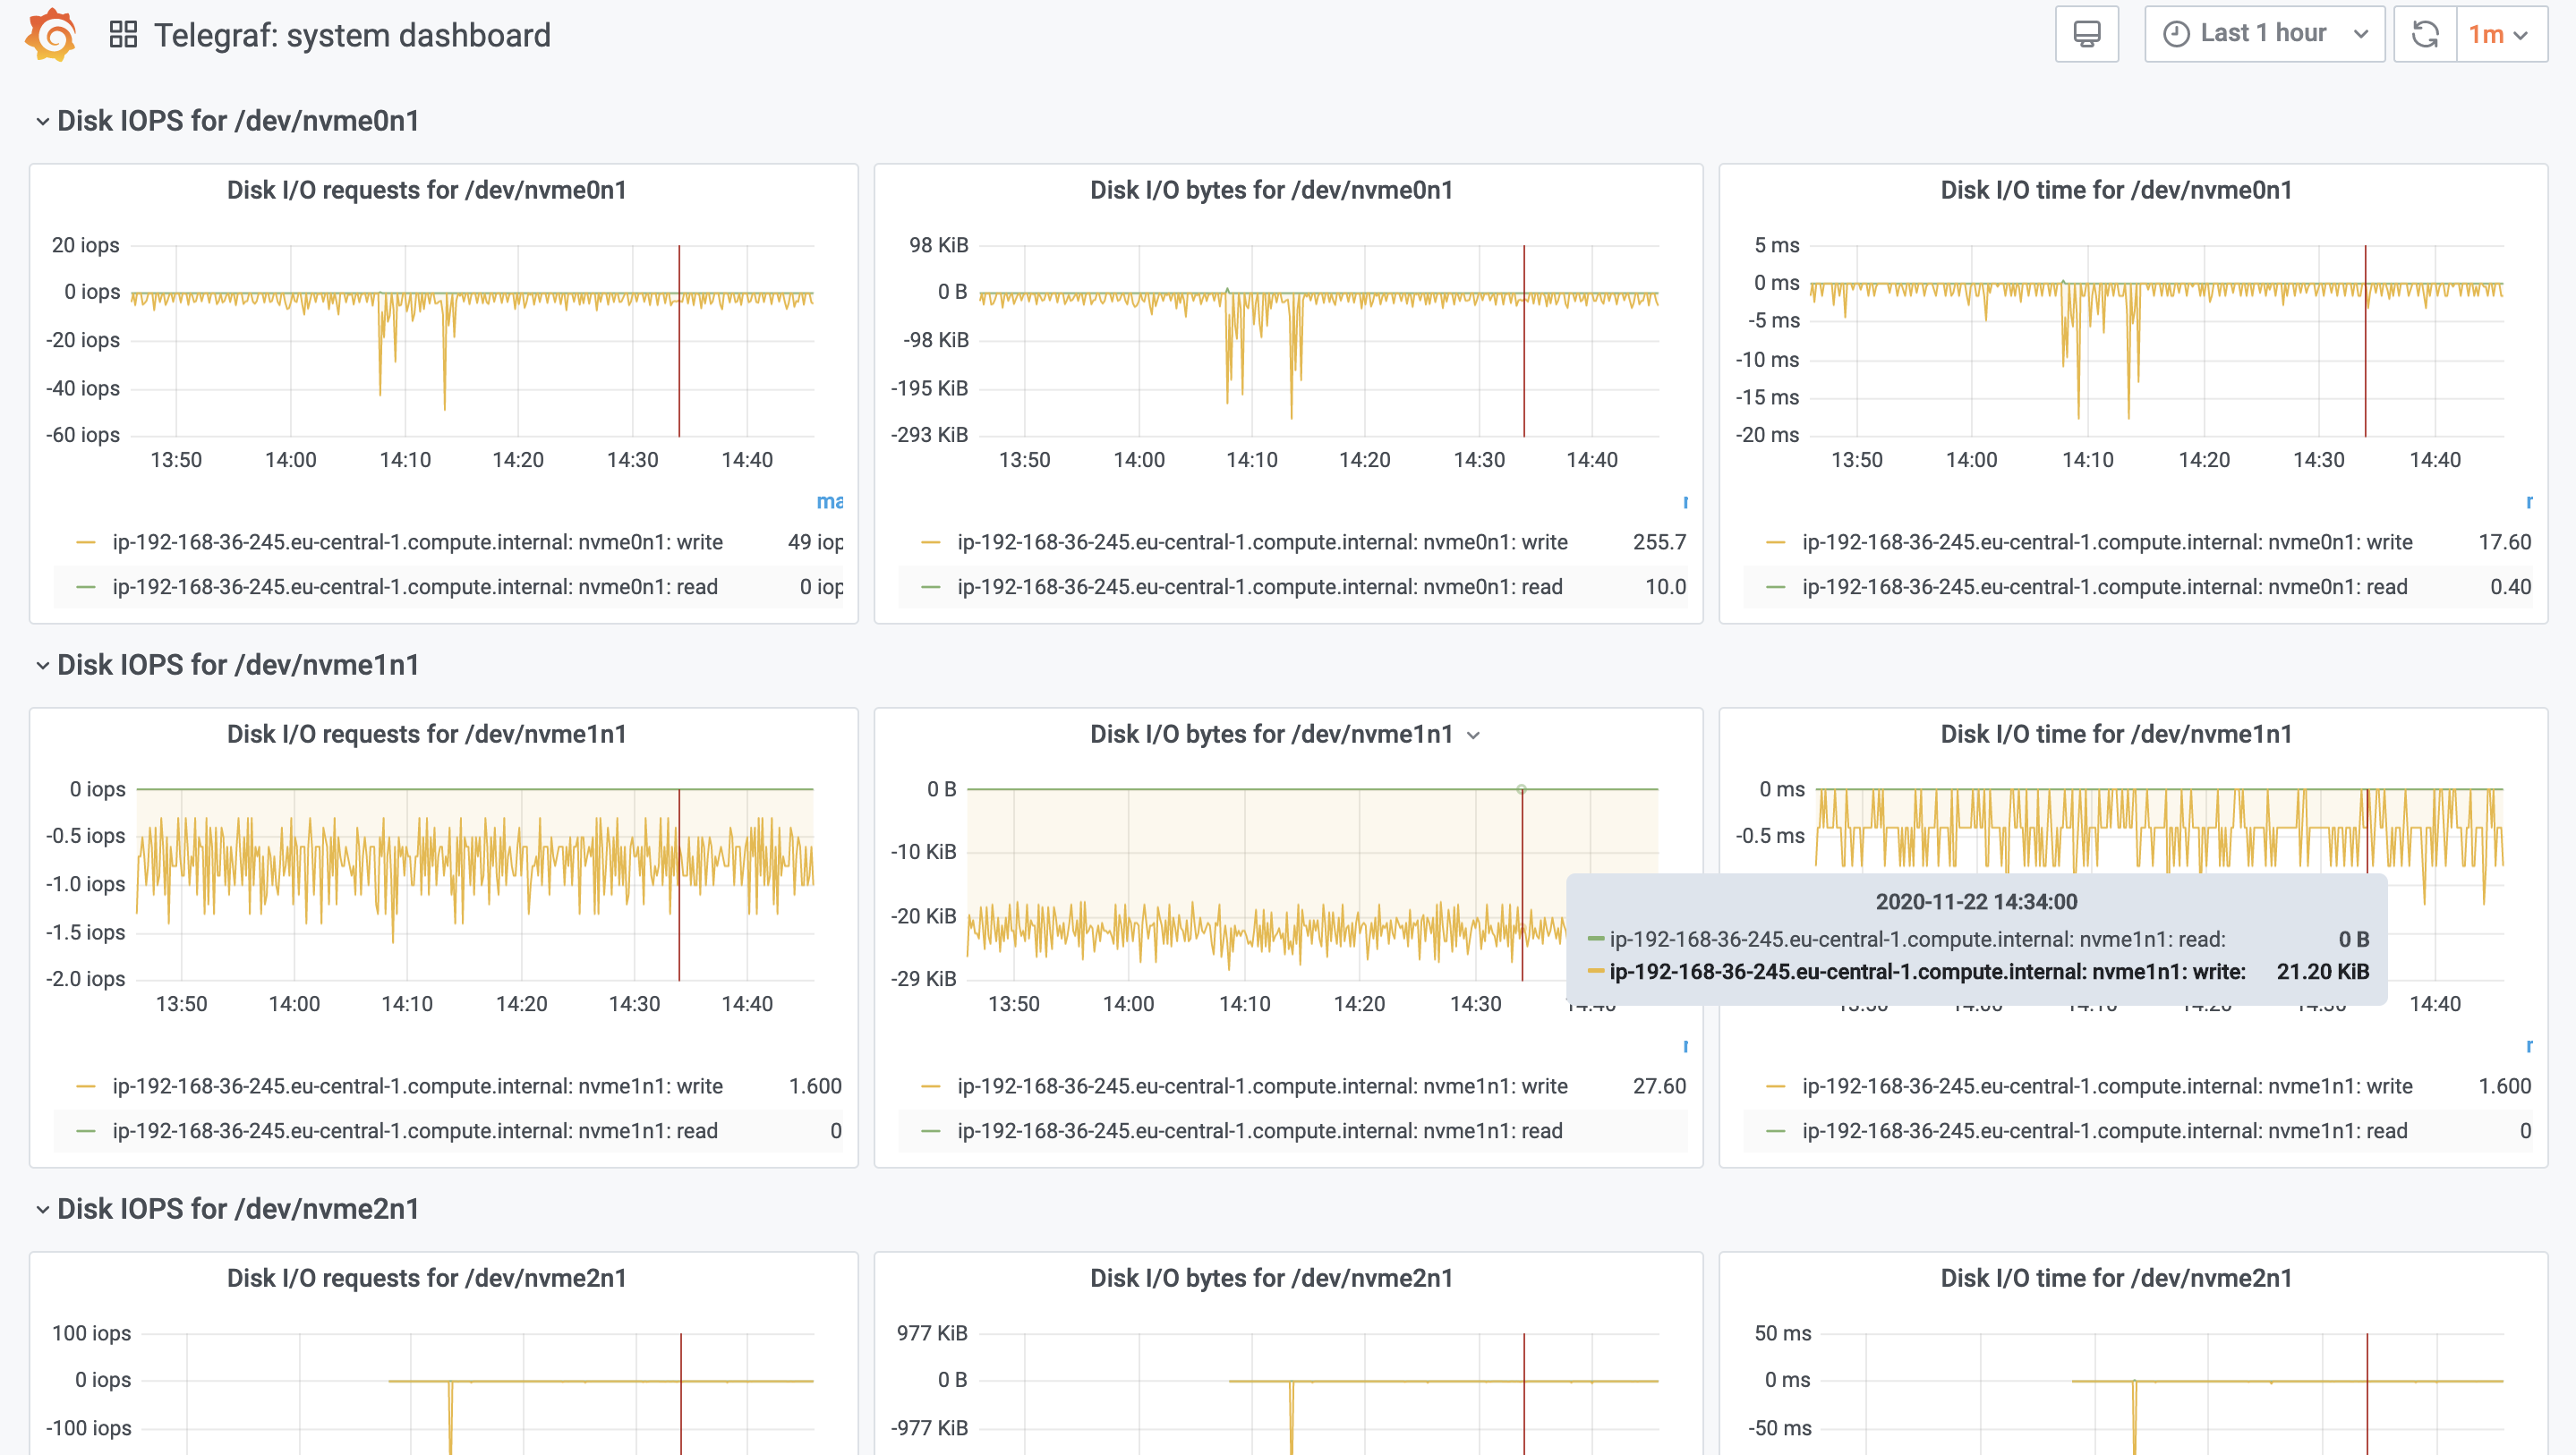
Monitoring your infrastructure and applications is a must-have if you play your game seriously. Overseeing your entire landscape, running servers, cloud spends, VMs, containers, and the applications inside are extremely valuable to avoid outages or to fix things quicker. We at Starschema rely on open-source tools like InfluxDB, Telegraf, Grafana, and Slack to collect, analyze, and react to events. In this blog series, I will show you how we built our monitoring infra to monitor our cloud infrastructure, applications like Tableau Server and Deltek Maconomy, and data pipelines in Airflow, among others.
In this part, we will build up the basic infrastructure monitoring with InfluxDB, Telegraf, and Grafana on Amazon’s managed Kubernetes service: AWS EKS.

