Prometheus has become the de facto standard for the monitoring and alerting of distributed systems and architecture. Designed to overcome shortcomings in existing monitoring solutions, including a lack of scalability and deployment challenges, its core architecture, data collection and discovery services, and third-party integrations help to derive greater value.
In this Refcard, we explore the core components of the Prometheus architecture and key concepts — then focus on getting up and running with Prometheus, including configuration and both collecting and working with data.
GitOps is a set of principles for you to implement continuous deployment for cloud-native applications using Git as a single source of truth. With GitOps, you treat everything, including infrastructure, as source code and store it in Git. GitOps lets you automatically deploy code as soon as it is committed to a Git repository. Here are some of its benefits:
It offers a developer-centric approach
It promises high reliability with faster error recovery
It gives you complete visibility
It greatly increases your productivity
When adopting GitOps in any organization, it takes setting up a GitOps that is different from a more traditional CI/CD pipeline. Modern cloud-native tools make up this new pipeline. In this post, we list the most vital tools that make up a GitOps pipeline. We also discuss the practices that go along with these tools, which are sometimes more important than the tool itself. The list is not meant to be exhaustive but is a good indicator of the leading GitOps tools today.
Kubernetes is the industry-standard technology used by enterprises to deliver microservices-based container orchestration platforms. The Kubernetes ecosystem is growing rapidly and has a vibrant community that has built several free open-source tools and extensions to make it easier to run your workloads. This article will explain some of the more popular open-source Kubernetes tools used for development, monitoring, and deployment purposes that can improve your cloud-native experience.
We’re seeing a massive shift in how companies build their software. More and more, companies are building—or are rapidly transitioning—their applications to a microservice architecture. The monolithic application is giving way to the rise of microservices.
With an application segmented into dozens (or hundreds!) of microservices, monitoring and consolidated logging become imperative. At any given moment, one of your microservices could fail or throw an error or begin hogging resources. You need to monitor for this so that you can respond quickly and appropriately. In addition, your ability to troubleshoot errors and understand system behavior depends heavily on the existence and effectiveness of your logging tool.
Taking a proactive and efficient approach to Kubernetes cluster monitoring can help engineering teams identify and predict many critical problems like CPU outage, memory outage, storage issues well in advance of these issues taking a toll on a business. Companies of all sizes such as enterprises like CERN monitor petabytes of their Kubernetes cluster data to understand all their cluster workloads. Solving critical problems before they have the chance to make too significant an impact saves money, time, and reputation. The task is a challenge though as proper cluster monitoring can be a pain point for many companies as it’s important to be aware of what exactly we want to monitor in a cluster.
This article will discuss cluster monitoring fundamentals and how we can use Prometheus Operator to deploy Prometheus and Grafana to monitor a Kubernetes cluster.
A common architectural design pattern these days is to break up an application monolith into smaller microservices. Each microservice is then responsible for a specific aspect or feature of your app. For example, one microservice might be responsible for serving external API requests, while another might handle data fetching for your frontend.
Designing a robust and fail-safe infrastructure in this way can be challenging; monitoring the operations of all these microservices together can be even harder. It's best not to simply rely on your application logs for an understanding of your systems' successes and errors. Setting up proper monitoring will provide you with a more complete picture, but it can be difficult to know where to start. In this post, we'll cover service areas your metrics should focus on to ensure you're not missing key insights.
Distributed tracing, like logging and observability, is a key functionality for keeping your services healthy and predictable. Contrary to logs and observability, which shows what happens on a service, tracing allows developers and operators to follow a specific request and how it calls different services and dependencies. It is designed around microservices architecture, which—unlike monolith architecture—uses many small services to run a platform. These services communicate with each other as well as with external services to provide and store the information users request.
Using microservices over monolith architecture certainly has its benefits:
Openshift 4 provided great metrics monitor suites, we can use them to monitor and create dashboards for both infra and application layer services; What's more, we can leverage that to manage external services and infra as well.
The benefits why I want to address this issue are:
In this blog you will learn how to monitor a Spring Boot application. You will make use of Spring Actuator, Micrometer, Prometheus and Grafana. Seems a lot of work, but this is easier as you might think!
1. Introduction
When an application runs in production (but also your other environments), it is wise to monitor its health. You want to make sure that everything is running without any problems and the only way to know this, is to measure the health of your application. When something goes wrong, you hopefully will be notified before your customer notices the problem and maybe you can solve the problem before your customer notices anything. In this post, you will create a sample Spring Boot application which you can monitor with the help of Spring Actuator, Micrometer, Prometheus and Grafana. This is visualized in the overview below, where Spring Actuator and Micrometer are part of the Spring Boot App.
In a distributed systems environment, troubleshooting and debugging are critical and also very challenging tasks. WSO2 Micro Integrator offers the possibility to integrate with cloud-native monitoring tools in order to provide a comprehensive observability solution with log monitoring, message tracing, and metrics monitoring.
With WSO2 MI we have two approaches to help us deal with observability:
In one of my another articles, I discussed how to set up strimzi (also known as Kafka on Kubernetes) on minikube. Also, we discussed how to set up Grafana and Prometheus to fetch metrics from Kafka and zookeeper instances. But wouldn't it have been more helpful and more administrator-friendly if Grafana could also be used to monitor logs of all the pods? If there are multiple zookeeper and Kafka pods, a single window would certainly be a boon for administrators and management.
Grafana provides Loki and Promtail a functionality to aggregate logs and view them from the same Grafana UI.
At my current project, we've been building three different applications. All three applications are based on Spring Boot but have very different workloads. They've all reached their way to the production environment and have been running steadily for quite some time now. We do regular (weekly basis) deployments of our applications to production with bug fixes, new features, and technical improvements. The organisation has a traditional infrastructure workflow in the sense that deployments to the VM instances on acceptance and production happen via the (remote hosting) provider.
The hosting provider is responsible for the uptime of the applications and therefore they keep an eye on system metrics through the usage of their own monitoring system. As a team, we are able to look in the system, but it doesn't say much about the internals of our application. In the past, we've asked to add some additional metrics to their system, but the system isn't that easy to configure with additional metrics. To us as a team runtime statistics about our applications and the impact our changes have on the overall health are crucial to understanding the impact of our work.
Amazon Web Services (AWS) is a powerhouse cloud computing service allowing companies to produce computational functionality. They enable developers to quickly create serverless functions, which quickly delivers new features to consumers without scaling up infrastructure, taking both time and cost. The downside to this speed is that tracking and observing these functions’ health issues can be difficult, especially when running microservices. AWS provides several tools to assist developers in understanding their system’s health and are in the process of delivering new tools as well.
Observability With AWS CloudWatch
CloudWatch is AWS’s monitoring and insight service. Developers use CloudWatch to collect logs from compute functions and track performance information for many AWS services. Using this data, CloudWatch can create insights on which developers can develop alarms or insights. Using the combination of these tools, developers can create AWS observability tools that meet their needs.
In this tutorial, we will cover how to load demo data from .CSVfiles into QuestDB and use this as a data source for a Grafana dashboard. The dashboard will have line charts as data visualizations that make use of aggregate SQL functions and Grafana global variables for sampling data based on dashboard settings.
What Is Grafana?
Grafana is an open-source visualization tool. It consists of a server that connects to one or more data-sources to retrieve data, which is then visualized by the user in a browser.
Grafana in action — Learn how to set it up in your AWS cloud
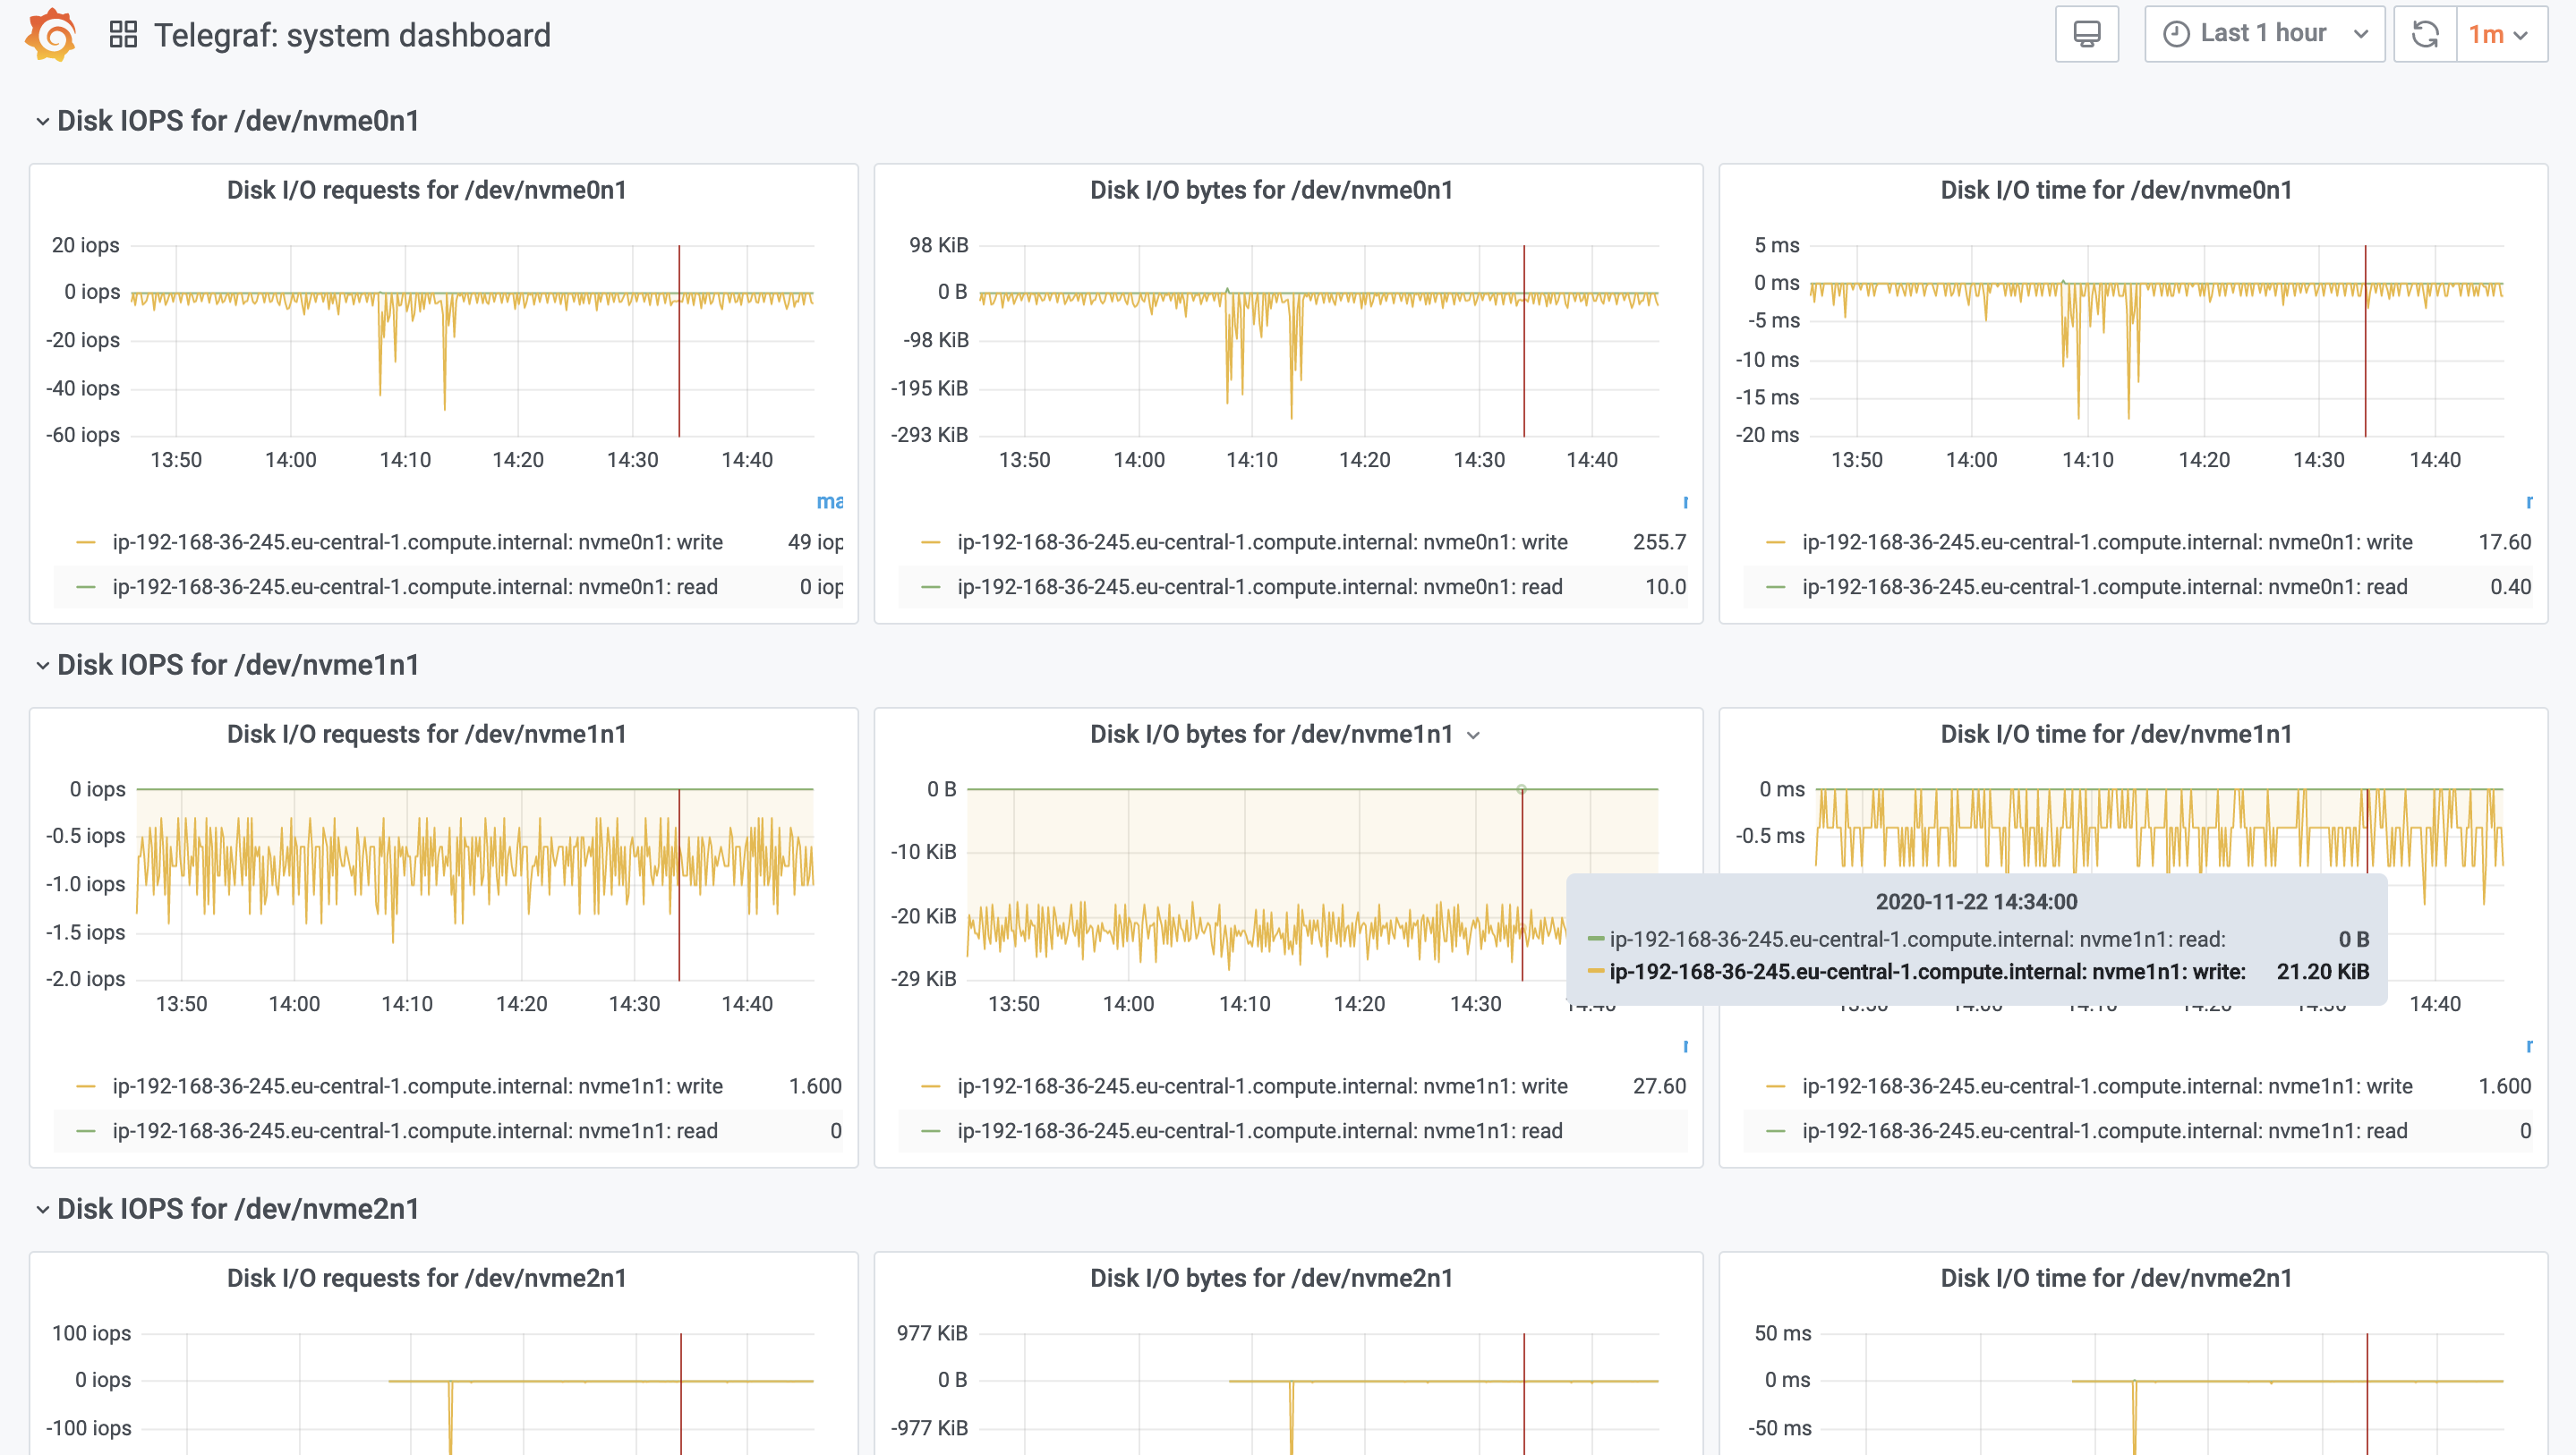
Monitoring your infrastructure and applications is a must-have if you play your game seriously. Overseeing your entire landscape, running servers, cloud spends, VMs, containers, and the applications inside are extremely valuable to avoid outages or to fix things quicker. We at Starschema rely on open-source tools like InfluxDB, Telegraf, Grafana, and Slack to collect, analyze, and react to events. In this blog series, I will show you how we built our monitoring infra to monitor our cloud infrastructure, applications like Tableau Server and Deltek Maconomy, and data pipelines in Airflow, among others.
In this part, we will build up the basic infrastructure monitoring with InfluxDB, Telegraf, and Grafana on Amazon’s managed Kubernetes service: AWS EKS.
In a production environment, a downtime of even a few microseconds is intolerable. Debugging such issues is time-critical. Proper logging and monitoring of infrastructure help in debugging such scenarios. It also helps in optimizing cost and other resources proactively, as well as helps to detect any impending issue which may arise in the near future. There are various logging and monitoring solutions available in the market. In this post, we will walk through the steps to deploy Grafana Loki in a Kubernetes environment. This is due to its seamless compatibility with Prometheus, a widely used software for collecting metrics. Grafana Loki consists of three components: Promtail, Loki, and Grafana (PLG), which we will see in brief before proceeding to the deployment. This article provides a better insight into the architectural differences of PLG and other primary logging and monitoring stack like Elasticsearch-FluentD-Kibana (EFK).
Logging, Monitoring, and Alerting With Grafana Loki
Before proceeding with the steps for deploying Grafana Loki, we will see each tool briefly.
We know that JMeter is one of the most popular and best tools to load and test functional behavior and measure performance. I love JMeter so much and a lot of real projects have been created using this tool. JMeter gives capabilities, like: building different load patterns through plugins, offline HTML reporting, scaling (master and slave nodes), access to a big community, and custom plugins. But we have no real-time monitoring out-of-the-box. This is not a problem; we can build a solution using an integration with Grafana + InfluxDB. This solution provides great capabilities and saves time.
In this article, we will see how quickly we can setup Grafana and Prometheus with Strimzi. So let us quickly go through the steps required for this setup.