How to Optimize WordPress Site Performance Using Delay JavaScript Execution

Looking for ways to further optimize your WordPress site’s performance? Easy…switch on Hummingbird‘s new Delay JavaScript Execution feature!

Most sites nowadays are laden with JavaScript files and inline scripts, which can be resource intensive and affect site performance and PageSpeed scores in areas like site rendering and load time.

As you will learn in this article, delaying the execution of JavaScript files to prioritise the load of more critical elements first can keep the overall load time of your site in check and improve your PageSpeed scores.

Even better, we’ll show you how to automate the whole process with just one click using our WordPress optimization plugin, Hummingbird.

In this article, we’ll look at:

Let’s jump right in…

Why Delaying JavaScript Execution Helps To Optimize Site Performance

As mentioned earlier, sites nowadays are loaded with 3rd-party scripts for serving advertisements, tracking engagement, security verification, etc., which can block pages from rendering quickly on users’ browsers and affect your site’s user experience and search engine rankings.

Holding these scripts off from loading on your site until there’s actual user interaction with the page can significantly improve areas of your site’s performance like:

1. Faster Page Loading Times

By delaying the execution of JavaScript files until users interact with the page, web pages will load faster, allowing users to access and interact with the site more quickly. This helps improve user experience and increase user engagement.

2. Improved Rendering Performance

Browser rendering engines need to process JavaScript before they can display the page content. Delaying JavaScript execution until after users interact the page content has been loaded helps the browser render the page more quickly and efficiently. This means users can see and interact with the web page sooner.

3. Reduced HTTP Requests

Combining JavaScript files and loading them asynchronously can reduce the number of HTTP requests made to the server, which also helps to speed up page loading times.

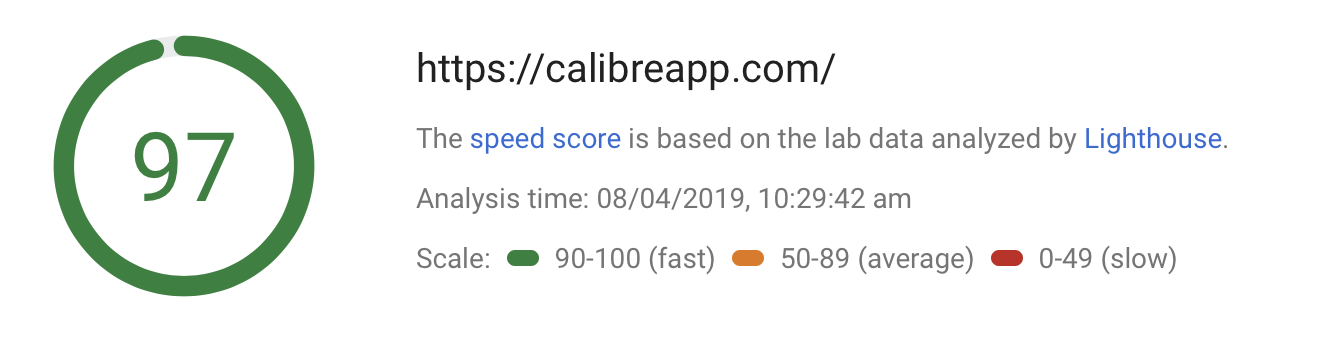
4. Increased Google PageSpeed Insights Score

Google considers page speed as a ranking factor for search results, and delaying JavaScript execution can improve your site’s PageSpeed Insights score, potentially leading to better search engine rankings.

5. Lower Server Load

By loading JavaScript asynchronously and combining files, fewer requests are made to the server, reducing its workload, and helping to prevent server crashes or slow responses during high-traffic situations.

Improving PageSpeed Score Recommendations

PageSpeed Insights score
Want to improve your PageSpeed Insights score? Try delaying JavaScript file execution.

Delaying JavaScript execution on your site can improve your Google PageSpeed score by addressing the following recommendations:

Remove unused JavaScript

This recommendation suggests eliminating unused or unnecessary JavaScript code from your web pages. Unused JavaScript can increase your page’s load time, as the browser has to download, parse, and execute the code even if it’s not being used.

By removing any unused JavaScript code, you can decrease the file size and improve your website’s overall performance.

Total blocking time

Total blocking time is a metric that measures the amount of time between the First Contentful Paint (FCP) and the Time to Interactive (TTI) during which the main thread was blocked for long enough to prevent input responsiveness.

In simple terms, it quantifies the duration when the page becomes unresponsive due to processing heavy JavaScript tasks. Lowering the total blocking time makes your website more responsive and improves user experience.

Minimize main thread work

The main thread is responsible for executing JavaScript, style calculations, layout, and other tasks required to display a web page. Minimizing main thread work refers to the process of optimizing the code and reducing the time the main thread spends on heavy tasks. This can be done by removing unnecessary JavaScript, splitting long tasks into smaller chunks, and optimizing the code’s execution.

A lighter workload on the main thread results in faster page loading, improved rendering, and enhanced user experience.

Time to interactive (TTI)

This performance metric measures the time it takes for a web page to become fully interactive and responsive to user input. A page is considered interactive when the main thread is free from heavy tasks, and users can interact with the elements on the screen, such as clicking buttons or scrolling.

Improving the TTI by optimizing JavaScript, splitting large tasks, and reducing render-blocking resources ensures a better user experience by allowing users to interact with the page more quickly.

Reduce JS execution time

Reducing JavaScript execution time involves optimizing the code to execute faster and use fewer resources. This can be achieved through techniques such as code minification, removing unused JavaScript, and optimizing algorithms.

Reducing the execution time leads to faster rendering, decreased total blocking time, and better responsiveness, providing a better user experience.

First Contentful Paint (FCP)

This is a performance metric that measures the time it takes for the browser to render the first visible element (text, image, or other content) of a web page. A faster FCP equates to a quicker initial page load, providing users with a visual feedback that the page is loading. Improving FCP requires optimizing critical rendering paths, delaying non-critical JavaScript execution, and prioritizing the loading of visible content.

A faster FCP significantly contributes to a better user experience and improved web page performance.

Delaying JavaScript Execution Methods

While faster page load times, reduced render-blocking, and prioritized content loading provide many benefits to users and can deliver higher PageSpeed scores, the actual methods available for delaying JavaScript execution on WordPress sites can be challenging for users without technical knowledge or web optimization skills.

For example, these methods can include:

  • Implement async or defer attributes: This requires you to manually add async or defer attributes to your JavaScript files in the HTML header, which tells the browser not to block the page rendering while processing the JavaScript files.
  • Combine JavaScript files: Use online tools or WordPress plugins to combine multiple JavaScript files into a single file, helping to reduce the number of HTTP requests and speed up page loading times.
  • Minify JavaScript files: Use online tools or WordPress plugins to reduce JavaScript file size, which helps to improve page loading times.
  • Prioritize critical JavaScript: Identify the critical JavaScript that needs to be loaded immediately to ensure proper functionality, and then load the remaining JavaScript files after the page content has been rendered.

While there are a few WordPress plugins available that can handle some of these tasks for you and help you to delay or defer JavaScript execution, our Hummingbird plugin does all of the above and more with the click of a button.

How to Use Hummingbird’s Delay JavaScript Execution Feature

The new optimization feature of Hummingbird delays the loading of all JavaScript files and inline scripts until there is user interaction on the page (e.g. mouse movement, keyboard action or screen tap) and improves all of the PageSpeed recommendations described earlier.

To enable this feature, make sure that Hummingbird is installed and activated on your site, then navigate to Hummingbird > Asset Optimization > Extra Optimization in your WordPress admin and switch on the Enable Delay Javascript toggle button in the Tools > Delay Javascript section, then click Save Changes.

Hummingbird's Delay JavaScript feature.
Enable Hummingbird’s Delay JavaScript feature to improve your site’s performance.

Alternatively, you can enable the feature from the plugin’s main dashboard.

Hummingbird dashboard: Asset Optimization - Delay JavaScript Execution
Enable Delay JavaScript Execution from Hummingbird’s dashboard.

Once the Delay JavaScript Execution feature has been enabled, it automatically goes to work, delaying the loading of any non-critical JavaScript files on your page that are not required above-the-fold.

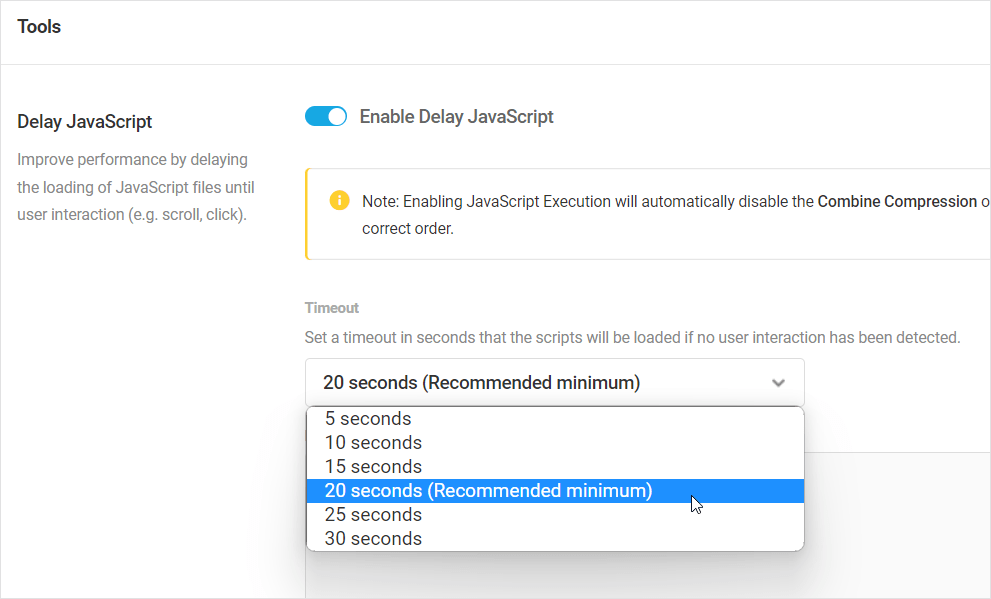
The feature’s settings give you access to options like being able to specify a timeout for the scripts to load if no user interaction is detected, and the option to exclude critical JavaScript files from from being delayed on load by specifying their URLs or keywords.

Hummingbird's Delay JavaScript settings
Hummingbird delays the loading of JavaScript files until a set timeout limit is reached or a user interacts with the page.

If enabling this feature breaks something on your site and you identify additional critical Javascript resources which are essential to render the page, simply add them to the Excluded JavaScript Files area to exclude them from being delayed.

If there is no user interaction on the page beyond a set threshold, the JavaScript assets are forced to load. The default timeout is set to 20 seconds, but you can select a different value from the Timeout dropdown menu (currently ranging between 5-30 seconds).

Hummingbird's Delay JavaScript Timeout options
Select a timeout option from the dropdown menu.

Notes

  • Enabling JavaScript Execution will automatically disable the Combine Compression option to ensure that your site’s scripts are loaded in their correct order.
  • The feature will only work when you’re connected to The Hub, as it pulls the list of continuously updated predefined exclusions from the API.
  • You can easily reverse any changes made by this feature by simply disabling the toggle and clicking save.

Delay JavaScript and Speed Up WordPress

Hummingbird’s Delay JavaScript feature is available in both the Pro and free versions of the plugin. We recommend enabling this feature and testing your site using the PageSpeed Insights tool.

If you experience any issues using Hummingbird, check out the plugin’s documentation or contact our 24/7 support team for immediate expert support.

How Google PageSpeed Works: Improve Your Score and Search Engine Ranking

This article is from my friend Ben who runs Calibre, a tool for monitoring the performance of websites. We use Calibre here on CSS-Tricks to keep an eye on things. In fact, I just popped over there to take a look and was notified of some little mistakes that slipped by, and I fixed them. Recommended!

In this article, we uncover how PageSpeed calculates it’s critical speed score.

It’s no secret that speed has become a crucial factor in increasing revenue and lowering abandonment rates. Now that Google uses page speed as a ranking factor, many organizations have become laser-focused on performance.

Last year, Google made two significant changes to their search indexing and ranking algorithms:

From this, we’re able to state two truths:

  • The speed of your site on mobile will affect your overall SEO ranking.
  • If your pages load slowly, it will reduce your ad quality score, and ads will cost more.

Google wrote:

Faster sites don’t just improve user experience; recent data shows that improving site speed also reduces operating costs. Like us, our users place a lot of value in speed — that’s why we’ve decided to take site speed into account in our search rankings.

To understand how these changes affect us from a performance perspective, we need to grasp the underlying technology. PageSpeed 5.0 is a complete overhaul of previous editions. It’s now being powered by Lighthouse and CrUX (Chrome User Experience Report).

This upgrade also brings a new scoring algorithm that makes it far more challenging to receive a high PageSpeed score.

What changed in PageSpeed 5.0?

Before 5.0, PageSpeed ran a series of heuristics against a given page. If the page has large, uncompressed images, PageSpeed would suggest image compression. Cache-Headers missing? Add them.

These heuristics were coupled with a set of guidelines that would likely result in better performance, if followed, but were merely superficial and didn’t actually analyze the load and render experience that real visitors face.

In PageSpeed 5.0, pages are loaded in a real Chrome browser that is controlled by Lighthouse. Lighthouse records metrics from the browser, applies a scoring model to them, and presents an overall performance score. Guidelines for improvement are suggested based on how specific metrics score.

Like PageSpeed, Lighthouse also has a performance score. In PageSpeed 5.0, the performance score is taken from Lighthouse directly. PageSpeed’s speed score is now the same as Lighthouse’s Performance score.

Calibre scores 97 on Google’s Pagespeed

Now that we know where the PageSpeed score comes from, let’s dive into how it’s calculated, and how we can make meaningful improvements.

What is Google Lighthouse?

Lighthouse is an open source project run by a dedicated team from Google Chrome. Over the past couple of years, it has become the go-to free performance analysis tool.

Lighthouse uses Chrome’s Remote Debugging Protocol to read network request information, measure JavaScript performance, observe accessibility standards and measure user-focused timing metrics like First Contentful Paint, Time to Interactive or Speed Index.

If you’re interested in a high-level overview of Lighthouse architecture, read this guide from the official repository.

How Lighthouse calculates the Performance Score

During performance tests, Lighthouse records many metrics focused on what a user sees and experiences. There are six metrics used to create the overall performance score. They are:

  • Time to Interactive (TTI)
  • Speed Index
  • First Contentful Paint (FCP)
  • First CPU Idle
  • First Meaningful Paint (FMP)
  • Estimated Input Latency

Lighthouse will apply a 0 – 100 scoring model to each of these metrics. This process works by obtaining mobile 75th and 95th percentiles from HTTP Archive, then applying a log normal function.

Following the algorithm and reference data used to calculate Time to Interactive, we can see that if a page managed to become "interactive" in 2.1 seconds, the Time to Interactive metric score would be 92/100.

Once each metric is scored, it’s assigned a weighting which is used as a modifier in calculating the overall performance score. The weightings are as follows:

Metric Weighting
Time to Interactive (TTI) 5
Speed Index 4
First Contentful Paint 3
First CPU Idle 2
First Meaningful Paint 1
Estimated Input Latency 0

These weightings refer to the impact of each metric in regards to mobile user experience.

In the future, this may also be enhanced by the inclusion of user-observed data from the Chrome User Experience Report dataset.

You may be wondering how the weighting of each metric affects the overall performance score. The Lighthouse team have created a useful Google Spreadsheet calculator explaining this process:

Picture of a spreadsheet that can be used to calculate performance scores

Using the example above, if we change (time to) interactive from 5 seconds to 17 seconds (the global average mobile TTI), our score drops to 56% (aka 56 out of 100).

Whereas, if we change First Contentful Paint to 17 seconds, we’d score 62%.

TTI is the most impactful metric to your performance score. Therefore, to receive a high PageSpeed score, you will need a speedy TTI measurement.

Moving the needle on TTI

At a high level, there are two significant factors that hugely influence TTI:

  • The amount of JavaScript delivered to the page
  • The run time of JavaScript tasks on the main thread

Our Time to Interactive guide explains how TTI works in great detail, but if you’re looking for some quick no-research wins, we’d suggest: Reducing the amount of JavaScript

Where possible, remove unused JavaScript code or focus on only delivering a script that will be run by the current page. That might mean removing old polyfills or replacing third-party libraries with smaller, more modern alternatives.

It’s important to remember that the cost of JavaScript is not only the time it takes to download it. The browser needs to decompress, parse, compile and eventually execute it, which takes non-trivial time, especially in mobile devices.

Effective measures for reducing the amount of scripts from your pages include:

  • Reviewing and removing polyfills that are no longer required for your audience.
  • Understanding the cost of each third-party JavaScript library. Use webpack-bundle-analyser or source-map-explorer to visualise the how large each library is.
  • Modern JavaScript tooling (like webpack) can break-up large JavaScript applications into a series of small bundles that are automatically loaded as a user navigates. This approach is known as code splitting and is extremely effective in improving TTI.
  • Service workers that will cache the bytecode result of a parsed and compiled script. If you’re able to make use of this, visitors will pay a one-time performance cost for parse and compilation. After that, it’ll be mitigated by cache.

Monitoring Time to Interactive

To successfully uncover significant differences in user experience, we suggest using a performance monitoring system (like Calibre!) that allows for testing a minimum of two devices; a fast desktop and a low-mid range mobile phone.

That way, you’ll have the data for both the best and worst case of what your customers experience. It’s time to come to terms that your customers aren’t using the same powerful hardware as you.

In-depth manual profiling

To get the best results in profiling JavaScript performance, test pages using intentionally slow mobile devices. If you have an old phone in a desk drawer, this is a great second-life for it.

An excellent substitute for using a real device is to use Chrome DevTools hardware emulation mode. We’ve written an extensive performance profiling guide to help you get started with runtime performance.

What about the other metrics?

Speed Index, First Contentful Paint and First Meaningful Paint are all browser-paint-based metrics. They’re influenced by similar factors and can often be improved at the same time.

It’s objectively easier to improve these metrics as they are calculated by how quickly a page renders. Following the Lighthouse Performance audit rules closely will result in these metrics improving.

If you aren’t already preloading your fonts or optimizing for critical requests, that is an excellent place to start a performance journey. Our article titled "The Critical Request" explains in great detail how the browser fetches and renders critical resources used to render your pages.

Tracking your progress and making meaningful improvements

Google's newly updated search console, Lighthouse and PageSpeed Insights, are a great way to get initial visibility into the performance of your pages but fall short for teams that need to continuously track and improve the performance of their pages.

Continuous performance monitoring is essential to ensuring speed improvements last, and teams get instantly notified when regressions happen. Manual testing introduces unexpected variability in results and makes testing from different regions as well as on various devices nearly impossible without a dedicated lab environment.

Speed has become a crucial factor for SEO rankings, especially now that nearly 50% of web traffic comes from mobile devices.

To avoid losing your search positioning, ensure you're using an up-to-date performance suite to track key pages. (Pssst, we built Calibre to be your performance companion. It has Lighthouse built-in. Hundreds of teams from around the globe are using it every day.)

Related Articles

The post How Google PageSpeed Works: Improve Your Score and Search Engine Ranking appeared first on CSS-Tricks.