i have 3 tables : users, deposit, withdraw table users :
id , username, referral
1, a1, null
2, a2, a1
3, a3, a2
4, a4, a1
5, a5, a2
table deposit :
id, users_id, amount, status, approve_date
1, 1, 10000.00, approve, 2022-10-01 14:52:53
2, 3, 10000.00, approve, 2022-10-01 14:52:53
3, 3, 10000.00, approve, 2022-10-01 14:52:53
4, 3, 10000.00, approve, 2022-10-01 14:52:53
5, 5, 10000.00, approve, 2022-10-01 14:52:53
table withdraw :
id, users_id, amount, status, approve_date
1, 1, 20000.00, approve, 2022-10-01 14:52:53
2, 3, 10000.00, approve, 2022-10-01 14:52:53
3, 3, 30000.00, approve, 2022-10-01 14:52:53
4, 3, 40000.00, approve, 2022-10-01 14:52:53
5, 5, 100000.00, approve, 2022-10-01 14:52:53
I would like to have the below end result, how do I combine the 3 tables together? The end result is sorted by SUM(deposit.amount) SUM(withdraw.amount) and where by approve date and search by referral . I apologize for couldn't display table data in a nice format for easier viewing. Thank you for your help.
what is try is like this sql code :
SELECT a.`referral`, a.`id`, a.`username`, SUM(b.`amount`) AS Total,SUM(c.`amount`) AS Totals FROM users a
LEFT JOIN  `deposit` b ON a.`id` = b.`user_id`
LEFT JOIN  `withdraw` c ON a.`id` = c.`user_id`
WHERE 1
AND b.`approve_date` >= '2022-10-01 00:00:00'
AND b.`approve_date` <= '2022-11-04 23:59:59'
AND b.`status` = 'approve'
AND c.`status` = 'approve'
AND a.`referral` = 'a1'
GROUP BY b.user_id,c.user_id
ORDER BY a.`id` DESC
LIMIT 500 OFFSET 0
Im not sure how to word the title of this question, but i have a table called "daily_recyclables". Inside this table, i have multiple columns of recyclable materials (example copper, stainless steel, brass etc etc)
In my PHP application, i have a statistic card (like below) that is supposed to display the total weight of each material in that table based on the current month we are in.
Heres a screenshot of the daily_recylables page to give you an idea: https://ibb.co/sybSC5w
This is my attemp to achieve that which is not working at all, and i do not even know how to make it display based only on entries in the current month automatically.
 <?php
$hostname="localhost";
$username="EXAMPLE";
$password="EXAMPLE";
$db = "EXAMPLE";
$dbh = new PDO("mysql:host=$hostname;dbname=$db", $username, $password);
foreach($dbh->query('SELECT SUM(weight)
FROM subgrade_bin WHERE subgrade = ?') as $row) {
echo "<tr>";
echo "<td>" . $row['SUM(weight)'] . "</td>". " KG";
echo "</tr>";
}
?>
Can someone guide this newby to some resources to assist me on how to do this?
My Table Columns are:
recID (INT AUTO INCREMENT), date,subgrade,castaluminium,copper,stainlesssteel,plastic,batteries,brass,lowgradePCB,mediumgradePCB,highgradePCB.
As one of the most powerful tools in Excel, PivotTable has the ability to calculate, summarize, and analyze data, which allows us to see the comparisons and trends of our data more intuitively. In addition, PivotTable also has the ability to sort and filter data, and it can meet our daily business reporting requirements. This article will introduce how to create an Excel PivotTable in Java application.
Installation
Method 1: You need to download the Free Spire.XLS for Java and unzip it. And then add the Spire.Xls.jar file to your project as dependency.
Method 2: If you use maven, you can easily add the jar dependency by adding the following configurations to the pom.xml.
import com.spire.xls.*;

public class CreatePivotTable {
    public static void main(String[] args)  {

    //Load a sample Excel workbook
    Workbook workbook = new Workbook();
    workbook.loadFromFile("Sample.xlsx");

    //Get the first worksheet
    Worksheet sheet = workbook.getWorksheets().get(0);

    // Add a PivotTable to the worksheet
    CellRange dataRange = sheet.getCellRange("A1:D11");
    PivotCache cache = workbook.getPivotCaches().add(dataRange);
    PivotTable pt = sheet.getPivotTables().add("Pivot Table", sheet.getCellRange("F3"), cache);

    // Add the fields to the row area.
    PivotField pf=null;
    if (pt.getPivotFields().get("Country") instanceof PivotField){
        pf= (PivotField) pt.getPivotFields().get("Country");
    }
    pf.setAxis(AxisTypes.Row);

    PivotField pf2 =null;
    if (pt.getPivotFields().get("Product") instanceof PivotField){
        pf2= (PivotField) pt.getPivotFields().get("Product");
    }
    pf2.setAxis(AxisTypes.Row);

    // Add the field to the data area.
    pt.getDataFields().add(pt.getPivotFields().get("Amount"), "SUM of Amount", SubtotalTypes.Sum);

    //Set PivotTable style
    pt.setBuiltInStyle(PivotBuiltInStyles.PivotStyleMedium12);

    //Save the document
    workbook.saveToFile("CreatePivotTable.xlsx", ExcelVersion.Version2013);
    }
}
People say JAMstack sites are fast — let’s find out why by looking at real performance metrics! We’ll cover common metrics, like Time to First Byte (TTFB) among others, then compare data across a wide section of sites to see how different ways to slice those sites up compare.
First, I’d like to present a small analysis to provide some background. According to the HTTPArchive metrics report on page loading, users wait an average of 6.7 seconds to see primary content.
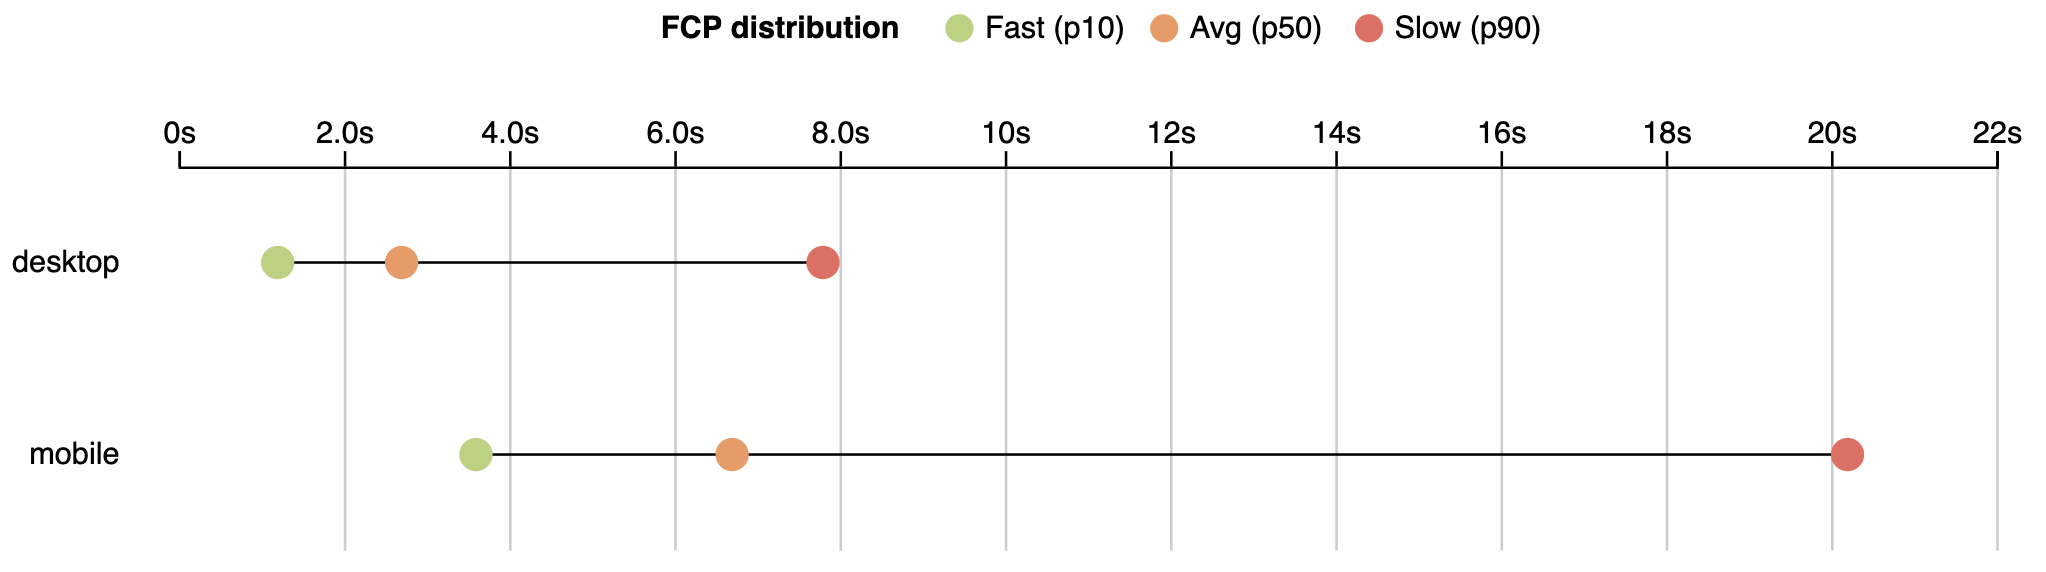
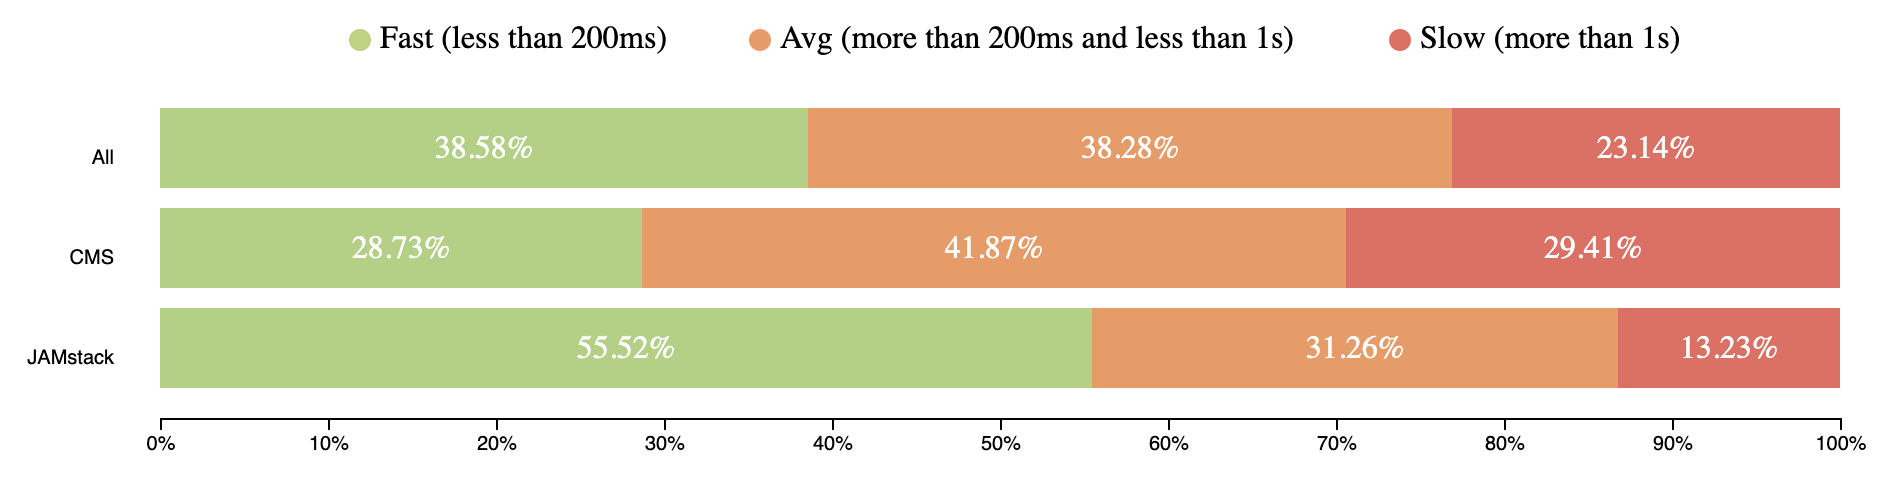
First Contentful Paint (FCP) - measures the point at which text or graphics are first rendered to the screen.
The FCP distribution for the 10th, 50th and 90th percentile values as reported on August 1, 2019.
If we are talking about engagement with a page (Time to Interactive), users wait even longer. The average time to interactive is 9.3 seconds.
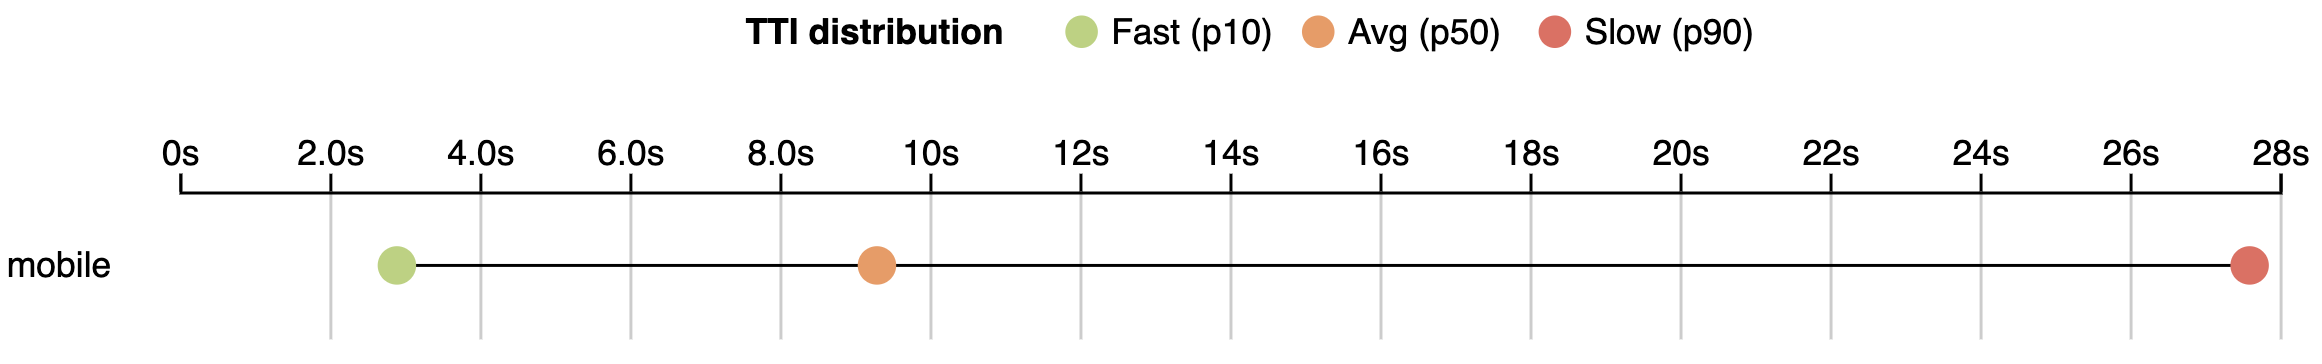
Time to Interactive (TTI) - a time when user can interact with a page without delay.
TTI distribution for the 10th, 50th and 90th percentile values as reported on August 1, 2019.
State of the real user web performance
The data above is from lab monitoring and doesn't fully represent real user experience. Real users data based taken from the Chrome User Experience Report (CrUX) shows an even wider picture.
I’ll use data aggregated from users who use mobile devices. Specifically, we will use metrics like:
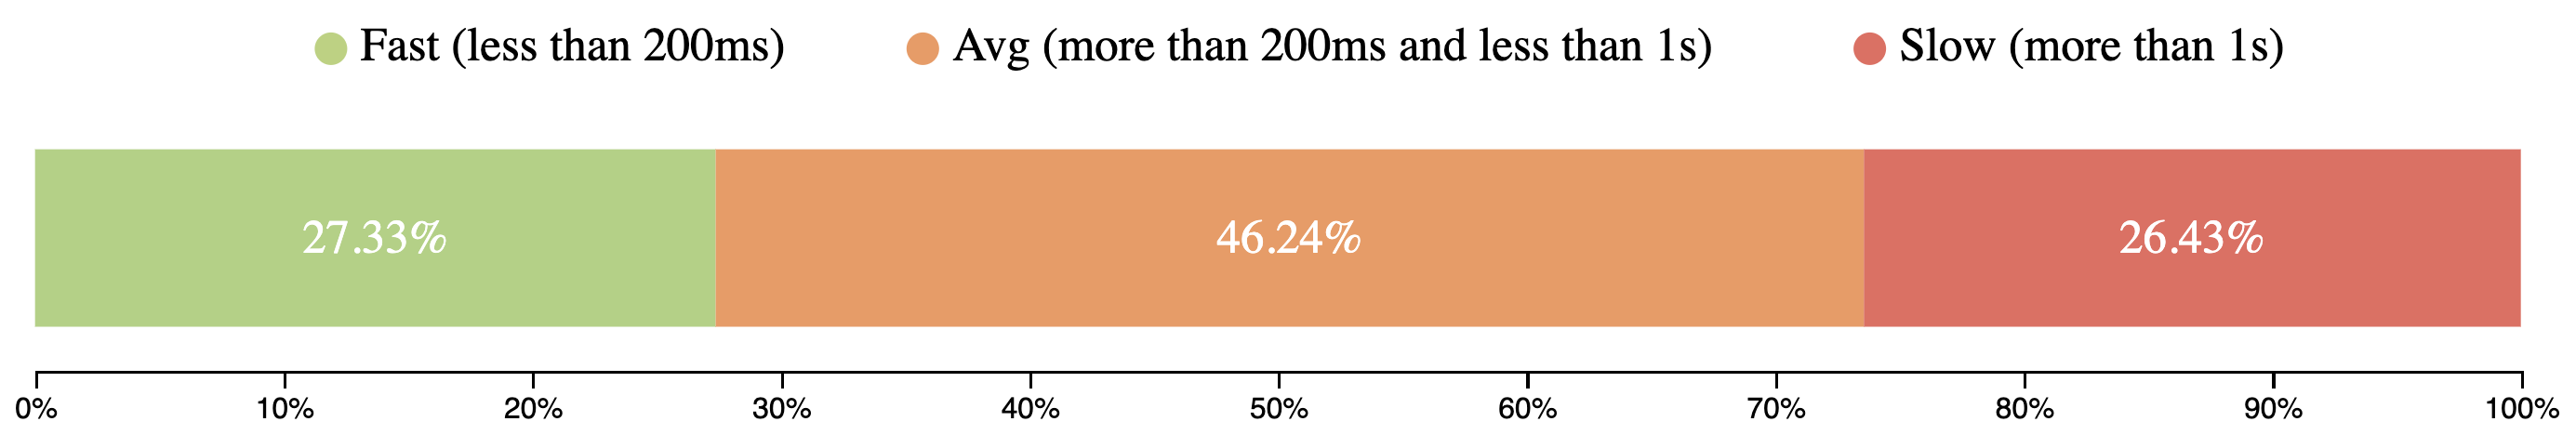
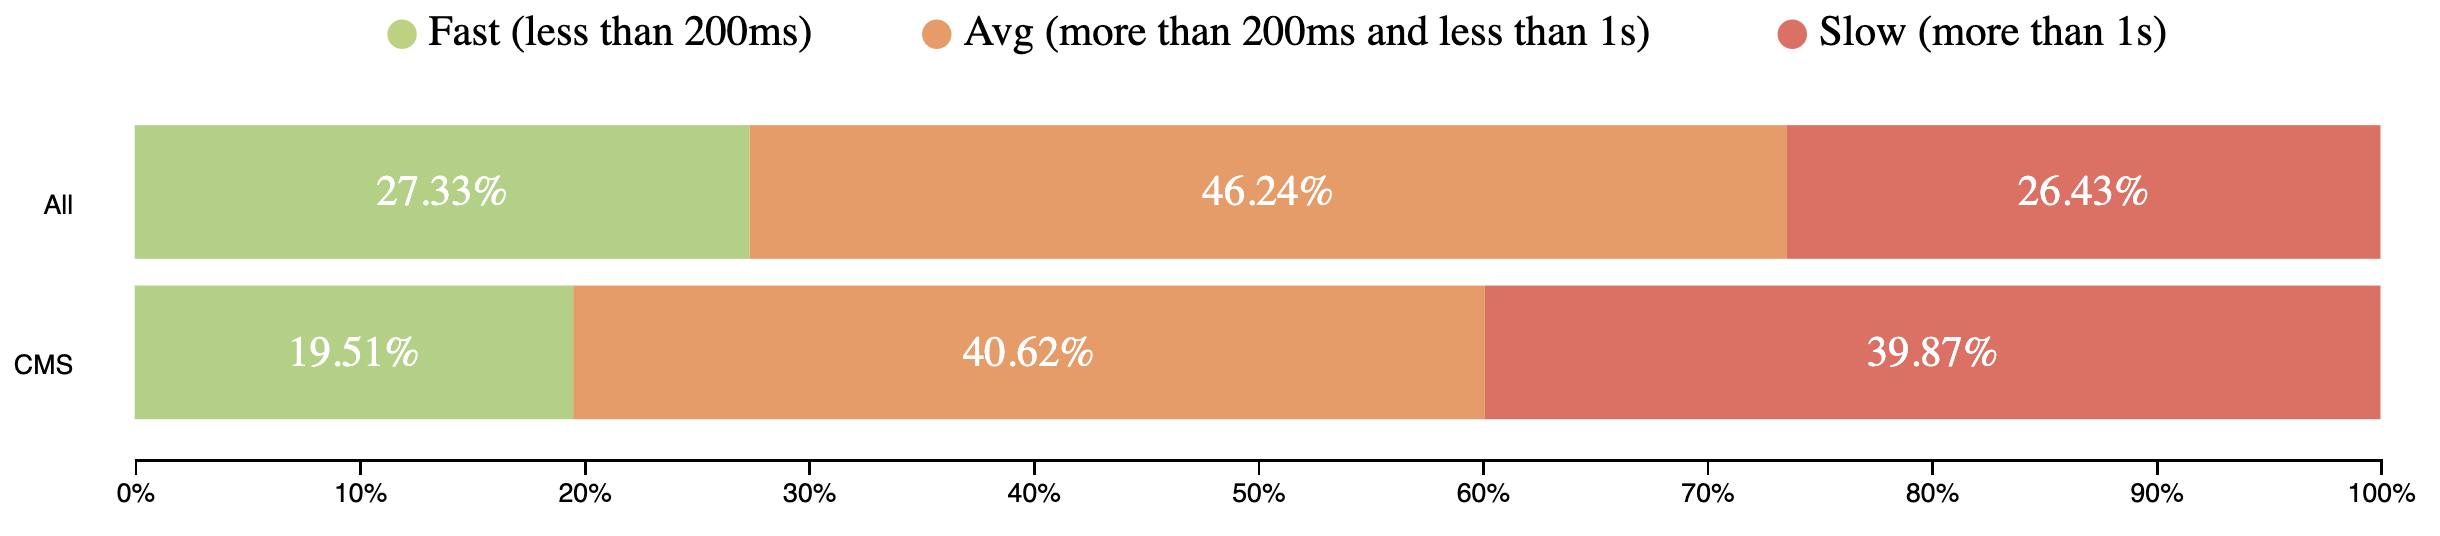
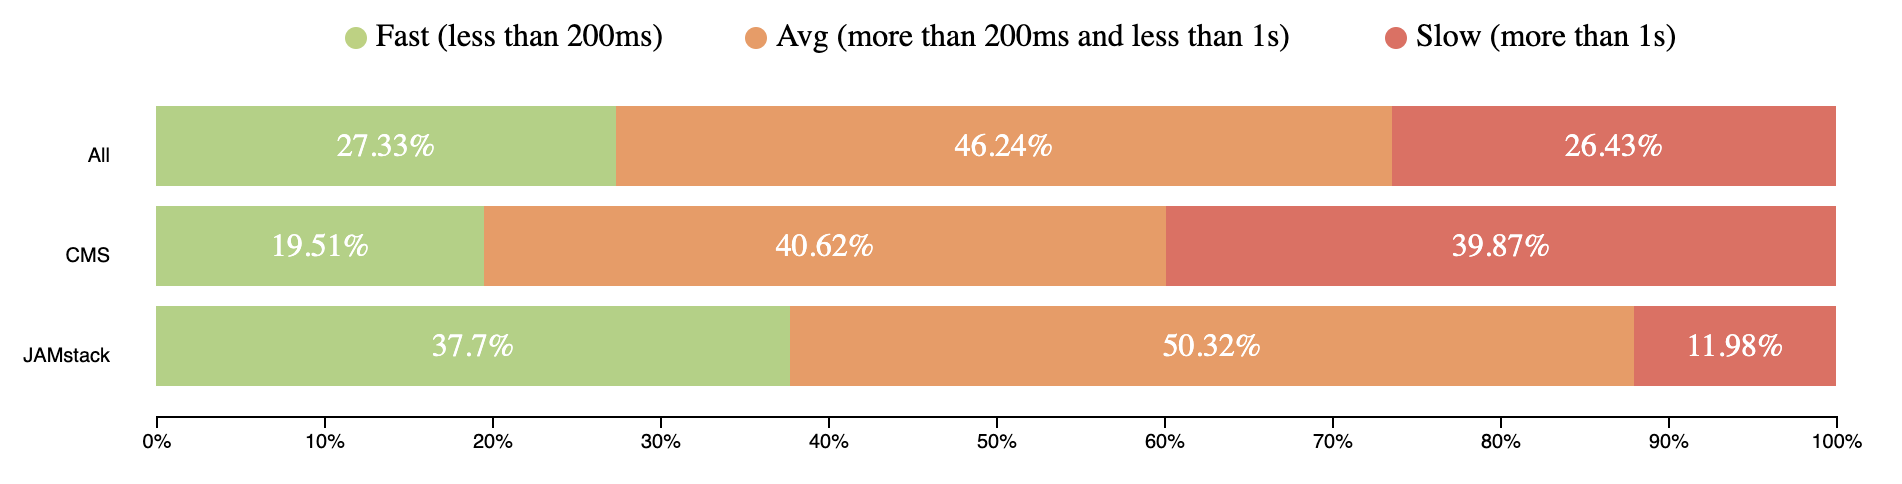
TTFB represents the time browser waits to receive first bytes of the response from server. TTFB takes from 200ms to 1 second for users around the world. It’s a pretty long time to receive the first chunks of the page.
TTFB mobile speed distribution (CrUX, July 2019)
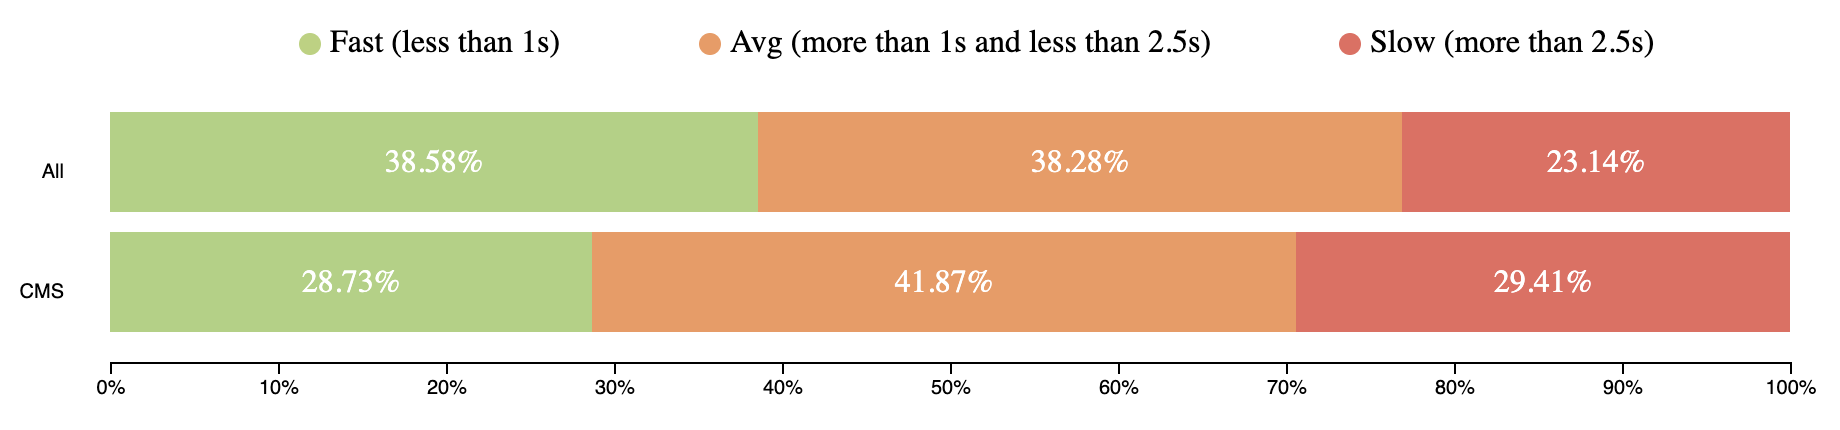
First Contentful Paint
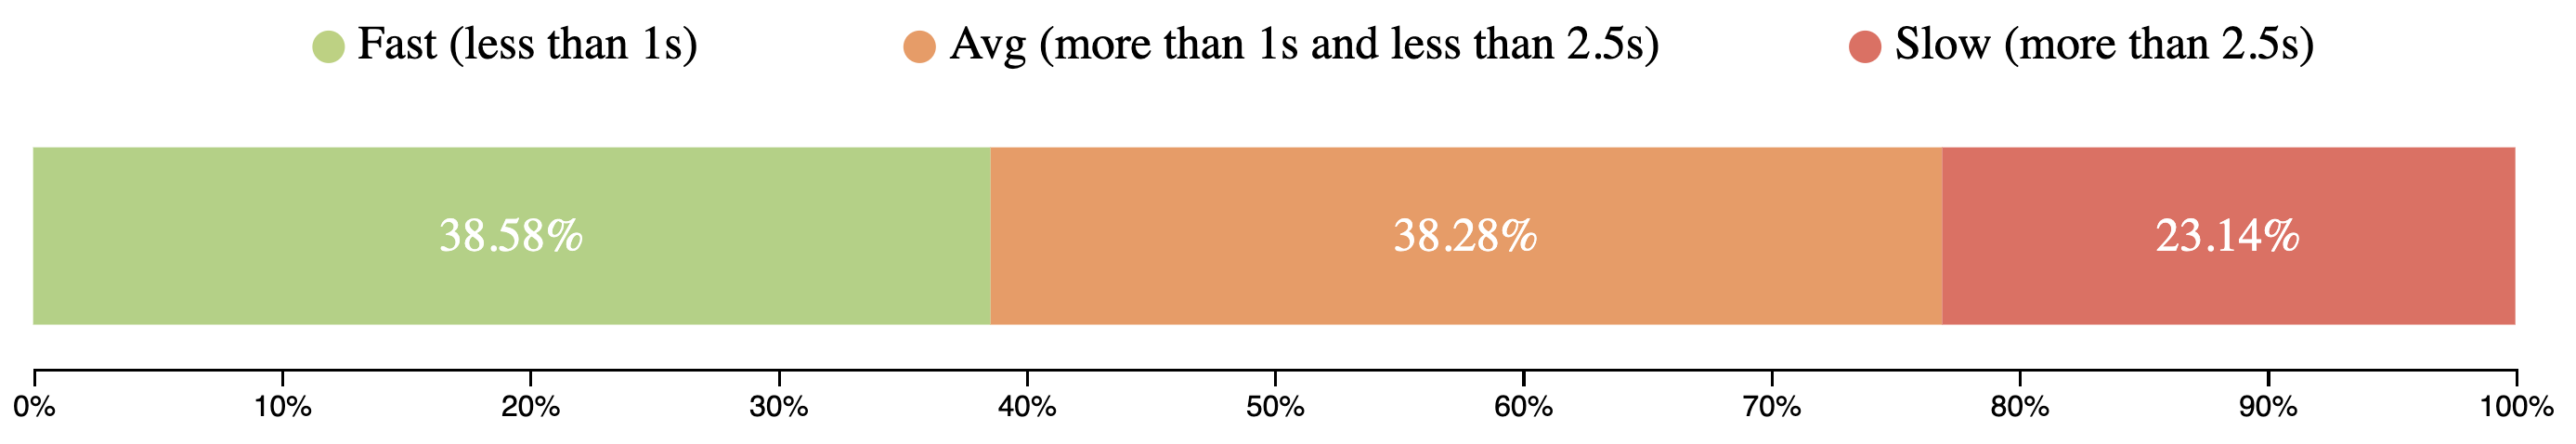
FCP happens after 2.5 seconds for 23% of page views around the world.
FCP mobile speed distribution (CrUX, July 2019)
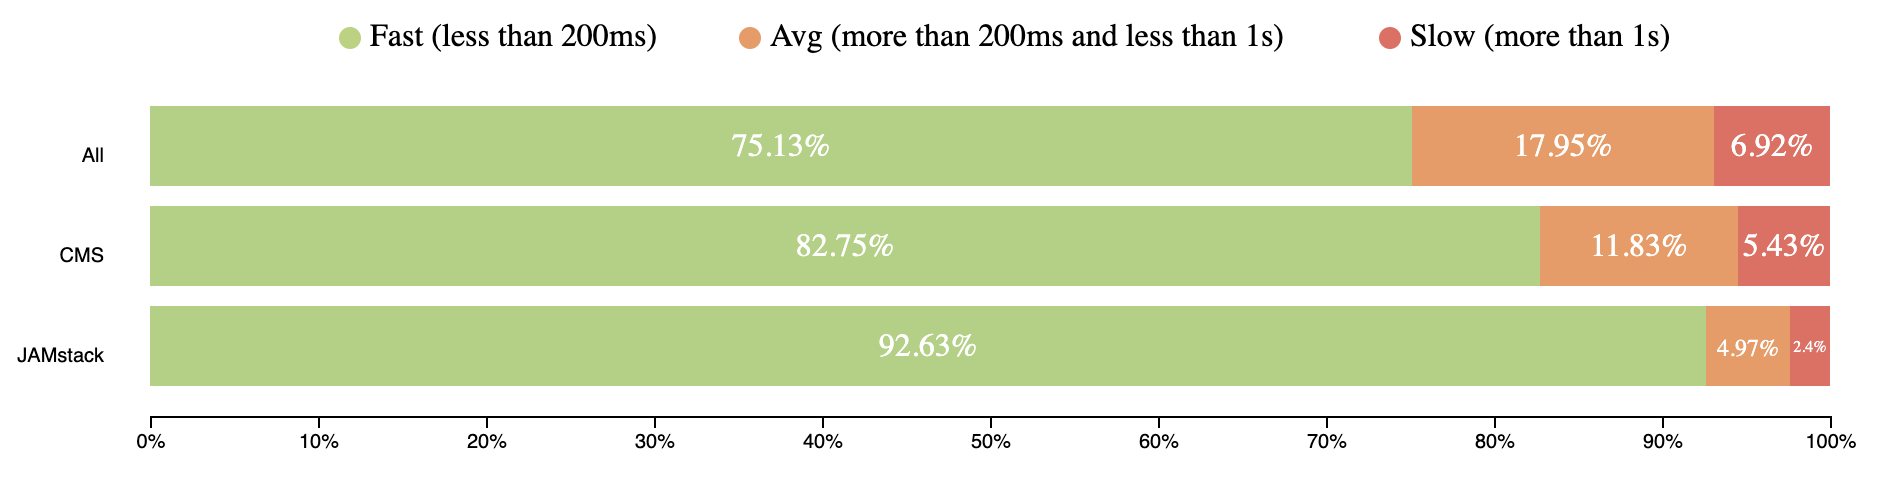
First Input Delay
FID metrics show how fast web pages respond to user input (e.g. click, scroll, etc.).
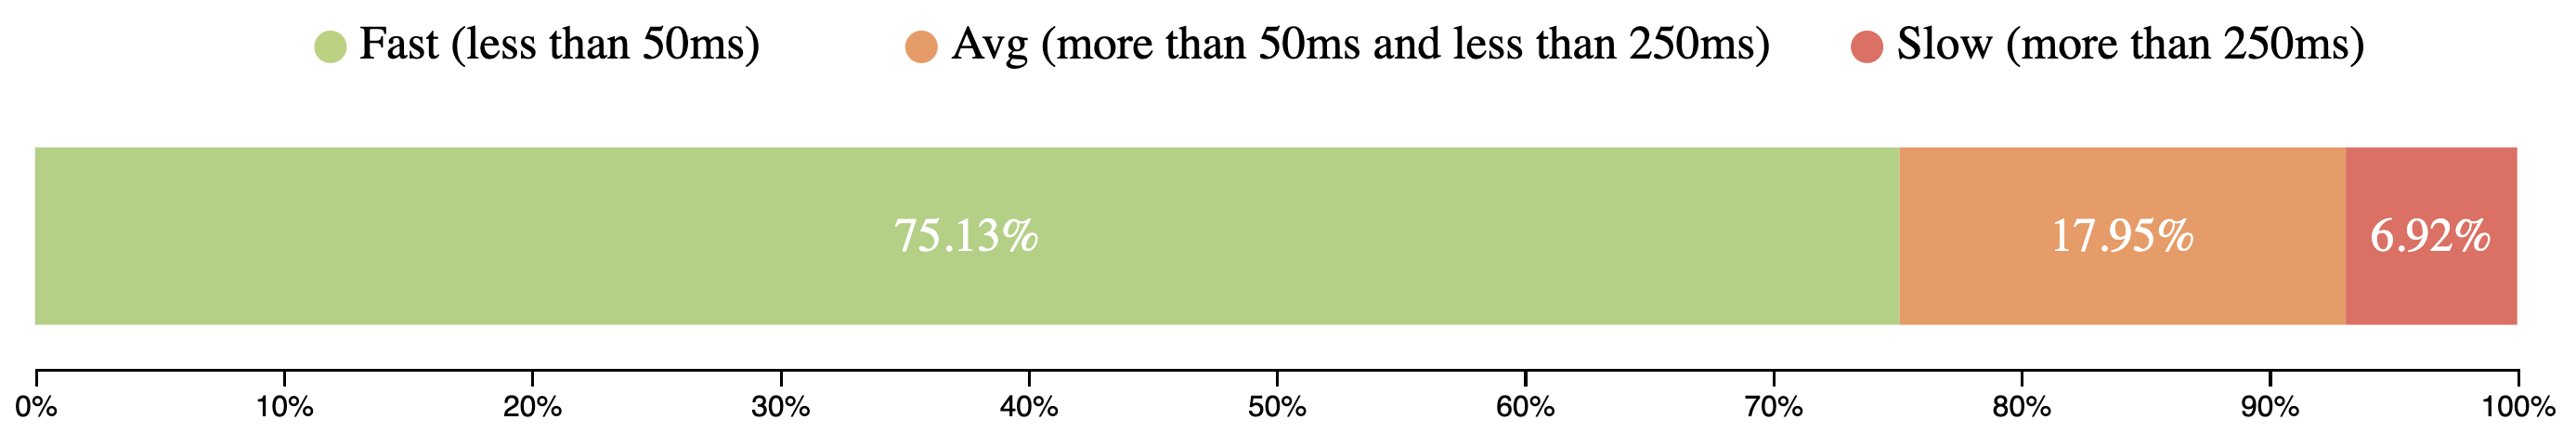
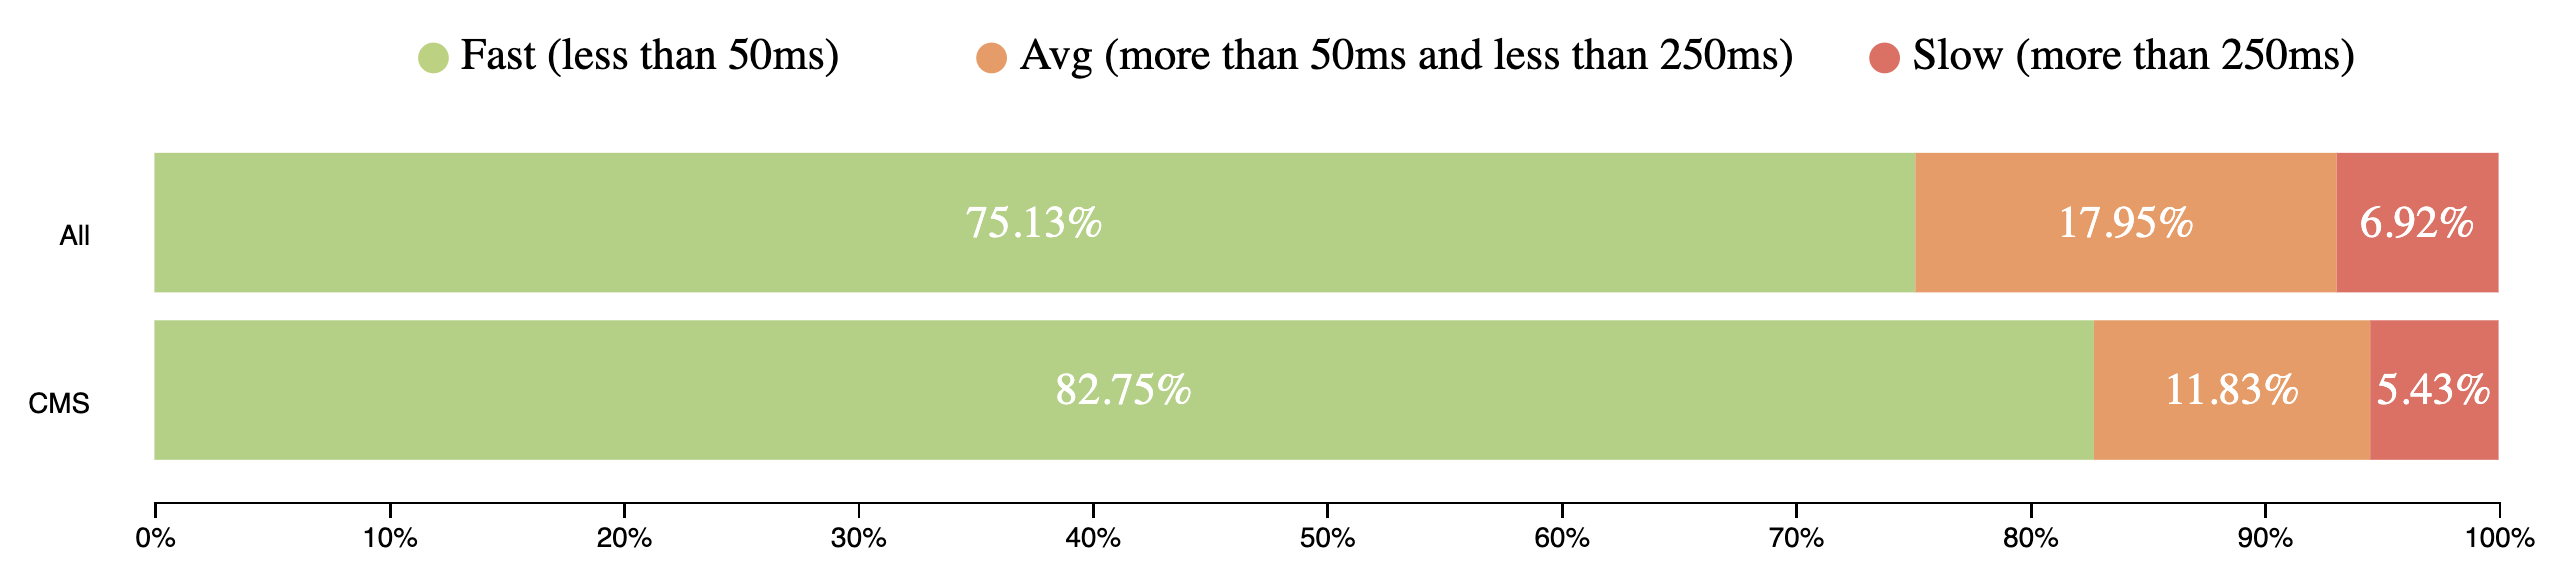
CrUX doesn’t have TTI data due to different restrictions, but has FID, which is even better can reflect page interactivity. Over 75% of mobile user experiences have input delay for 50ms and users didn't experience any jank.
FID mobile speed distribution (CrUX, July 2019)
You can use the queries below and play with them on this site.
#standardSQL
  SELECT
    REGEXP_REPLACE(yyyymm, '(\\d{4})(\\d{2})', '\\1_\\2_01') AS date,
    UNIX_DATE(CAST(REGEXP_REPLACE(yyyymm, '(\\d{4})(\\d{2})', '\\1-\\2-01') AS DATE)) * 1000 * 60 * 60 * 24 AS timestamp,
    IF(device = 'desktop', 'desktop', 'mobile') AS client,
    ROUND(SUM(fast_fcp) * 100 / (SUM(fast_fcp) + SUM(avg_fcp) + SUM(slow_fcp)), 2) AS fastFCP,
    ROUND(SUM(avg_fcp) * 100 / (SUM(fast_fcp) + SUM(avg_fcp) + SUM(slow_fcp)), 2) AS avgFCP,
    ROUND(SUM(slow_fcp) * 100 / (SUM(fast_fcp) + SUM(avg_fcp) + SUM(slow_fcp)), 2) AS slowFCP,
    ROUND(SUM(fast_fid) * 100 / (SUM(fast_fid) + SUM(avg_fid) + SUM(slow_fid)), 2) AS fastFID,
    ROUND(SUM(avg_fid) * 100 / (SUM(fast_fid) + SUM(avg_fid) + SUM(slow_fid)), 2) AS avgFID,
    ROUND(SUM(slow_fid) * 100 / (SUM(fast_fid) + SUM(avg_fid) + SUM(slow_fid)), 2) AS slowFID
  FROM
    `chrome-ux-report.materialized.device_summary`
  WHERE
    yyyymm = '201907'
  GROUP BY
    date,
    timestamp,
    client
  ORDER BY
    date DESC,
    client
State of Content Management Systems (CMS) performance
CMSs should have become our saviors, helping us build faster sites. But looking at the data, that is not the case. The current state of CMS performance around the world is not so great.
TTFB mobile speed distribution comparison between all web and CMS (CrUX, July 2019)Data from July 2019
E-Commerce websites, a good example of sites that are typically built on a CMS, have really bad stats for page views:
~40% - 1second for TTFB
~30% - more than 1.5 second for FCP
~12% - lag for page interaction.
I faced clients who requested support of IE10-IE11 because the traffic from those users represented 1%, which equalled millions of dollars in revenue. Please, calculate your losses in case 1% of users leave immediately and never came back because of bad performance. If users aren’t happy, business will be unhappy, too.
To get more details about how web performance correlates with revenue, check out WPO Stats. It’s a list of case studies from real companies and their success after improving performance.
With JAMstack, developers do as little rendering on the client as possible, instead using server infrastructure for most things. Not to mention, most JAMstack workflows are great at handling deployments, and helping with scalability, among other benefits. Content is stored statically on a static file hosts and provided to the users via CDN.
I had two years of experience working with one of the popular CMSs for e-commerce and we had a lot of problems with deployments, performance, scalability. The team would spend days and fixing them. It’s not what customers want. These are the sorts of big issues JAMstack solves.
Looking at the CrUX data, JAMstack sites performance looks really solid. The following values are based on sites served by Netlify and GitHub. There is some discussion on the HTTPArchive forum where you can participate to make data more accurate.
Here are the results for TTFB:
TTFB mobile speed distribution comparison between all web, CMS and JAMstack sites (CrUX, July 2019)Data from July 2019
#standardSQL
SELECT
  COUNT(DISTINCT origin) AS n,
  ROUND(SUM(IF(ttfb.start < 200, ttfb.density, 0)) / SUM(ttfb.density), 4) AS fastTTFB,
  ROUND(SUM(IF(ttfb.start >= 200 AND ttfb.start < 1000, ttfb.density, 0)) / SUM(ttfb.density), 4) AS avgTTFB,
  ROUND(SUM(IF(ttfb.start >= 1000, ttfb.density, 0)) / SUM(ttfb.density), 4) AS slowTTFB
FROM
  `chrome-ux-report.all.201907`,
  UNNEST(experimental.time_to_first_byte.histogram.bin) AS ttfb
JOIN
  (SELECT url, REGEXP_EXTRACT(LOWER(CONCAT(respOtherHeaders, resp_x_powered_by, resp_via, resp_server)),
      '(netlify|x-github-request)')
    AS platform
  FROM `httparchive.summary_requests.2019_07_01_mobile`)
ON
  CONCAT(origin, '/') = url
WHERE
  platform IS NOT NULL
ORDER BY
  n DESC
Here's how FCP shook out:
FCP mobile speed distribution comparison between all web, CMS and JAMstack sites (CrUX, July 2019)
Now let's look at FID:
FID mobile speed distribution comparison between all web, CMS and JAMstack sites (CrUX, July 2019)Data from July 2019
#standardSQL
  SELECT
    COUNT(DISTINCT origin) AS n,
    ROUND(SUM(IF(fcp.start < 1000, fcp.density, 0)) / SUM(fcp.density), 4) AS fastFCP,
    ROUND(SUM(IF(fcp.start >= 1000 AND fcp.start < 2500, fcp.density, 0)) / SUM(fcp.density), 4) AS avgFCP,
    ROUND(SUM(IF(fcp.start >= 2500, fcp.density, 0)) / SUM(fcp.density), 4) AS slowFCP,
    ROUND(SUM(IF(fid.start < 50, fid.density, 0)) / SUM(fid.density), 4) AS fastFID,
    ROUND(SUM(IF(fid.start >= 50 AND fid.start < 250, fid.density, 0)) / SUM(fid.density), 4) AS avgFID,
    ROUND(SUM(IF(fid.start >= 250, fid.density, 0)) / SUM(fid.density), 4) AS slowFID
  FROM
    `chrome-ux-report.all.201907`,
    UNNEST(first_contentful_paint.histogram.bin) AS fcp,
    UNNEST(experimental.first_input_delay.histogram.bin) AS fid
  JOIN
    (SELECT url, REGEXP_EXTRACT(LOWER(CONCAT(respOtherHeaders, resp_x_powered_by, resp_via, resp_server)),
        '(netlify|x-github-request)')
      AS platform
    FROM `httparchive.summary_requests.2019_07_01_mobile`)
  ON
    CONCAT(origin, '/') = url
  WHERE
    platform IS NOT NULL
  ORDER BY
    n DESC
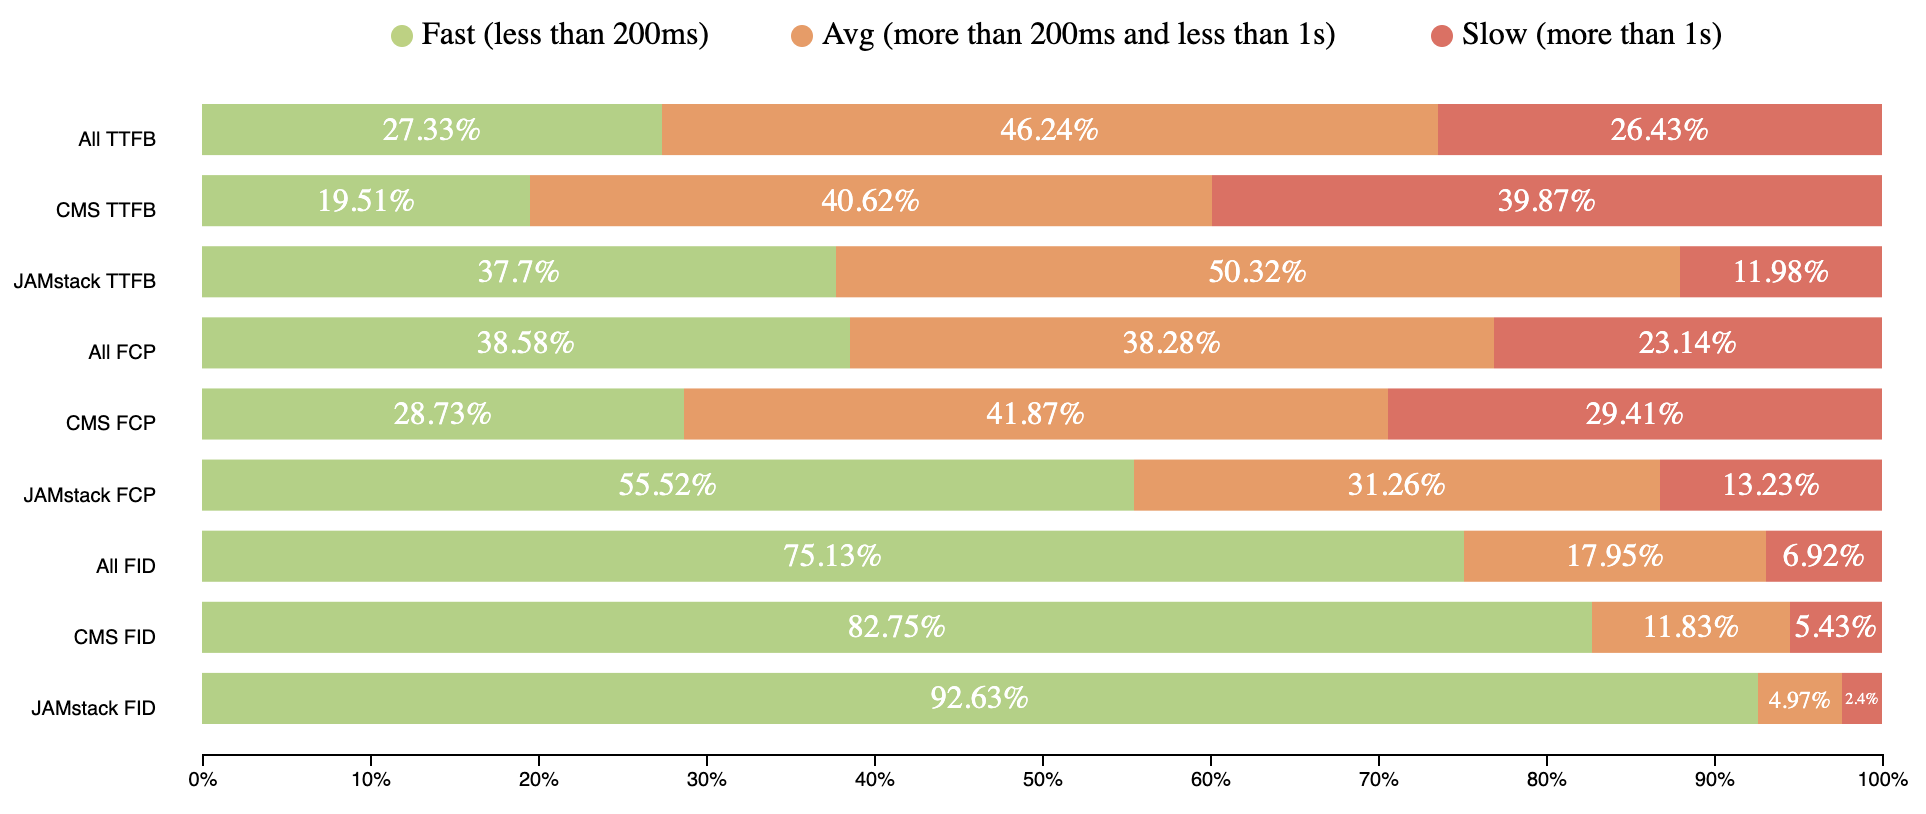
The numbers show the performance of JAMstack sites is the best. The numbers are pretty much the same for mobile and desktop which is even more amazing!
Some highlights from engineering leaders
Let me show you a couple of examples from some prominent folks in the industry:
Out of 468 million requests in the @HTTPArchive, 48% were not served from a CDN. I've visualized where they were served from below. Many of them were requests to 3rd parties. The client requesting them was in Redwood City, CA. Latency matters. #WebPerfpic.twitter.com/0F7nFa1QgM
JAMstack sites are generally CDN-hosted and mitigate TTFB. Since the file hosting is handled by infrastructures like Amazon Web Services or similar, all sites performance can be improved in one fix.
One more real investigation says that it is better to deliver static HTML for better FCP.
Which has a better First Meaningful Paint time?
① a raw 8.5MB HTML file with the full text of every single one of my 27,506 tweets ② a client rendered React site with exactly one tweet on it
(Spoiler: @____lighthouse reports 8.5MB of HTML wins by about 200ms)
Here's a comparison for all results shown above together:
Mobile speed distribution comparison between all web, CMS and JAMstack sites (CrUX, July 2019)
JAMstack brings better performance to the web by statically serving pages with CDNs. This is important because a fast back-end that takes a long time to reach users will be slow, and likewise, a slow back-end that is quick to reach users will also be slow.
JAMstack hasn’t won the perf race yet, because the number of sites built with it not so huge as for example for CMS, but the intention to win it is really great.
Adding these metrics to a performance budget can be one way make sure you are building good performance into your workflow. Something like:
TTFB: 200ms
FCP: 1s
FID: 50ms
Spend it wisely 🙂
Editor’s note: Artem Denysov is from Stackbit, which is a service that helps tremendously with spinning up JAMstack sites and more upcoming tooling to smooth out some of the workflow edges with JAMstack sites and content. Artem told me he’d like to thank Rick Viscomi, Rob Austin, and Aleksey Kulikov for their help in reviewing the article.
While the CROSS JOIN is not used much, and, depending on the size of your data it can be dangerous, there are some uses for it. For example, you may want to write a query that will summarize all the sales for the companies and people in your system. You can do this using what is called an aggregate operation or a GROUP BY:
SELECT c.CompanyName,
p.LastName,
SUM(ft.TransactionAmount) AS 'TransactionTotals'
FROM Management.Company AS c
JOIN Finance.FinancialTransaction AS ft
ON c.CompanyID = ft.CompanyID
JOIN Personnel.Person AS p
ON p.PersonID = ft.PersonID
GROUP BY c.CompanyName, p.LastName;