Automattic Launches Jetpack Boost: A New Performance Plugin

The Jetpack team has been quietly testing a new plugin called Jetpack Boost, which addresses website owners’ performance and SEO concerns. Version 1.0 was released today, one month after the final pre-release came out in March.

Boost is a separate plugin under the Jetpack brand and it does not require Jetpack core to work. The first iteration bundles three performance modules:

  1. Local Critical CSS generates optimized styles for the homepage, posts, and pages to display content faster, especially for visitors on mobile devices.
  2. Defer Non-Essential Javascript moves some tasks to after the page loads, so visible items load faster.
  3. Lazy Image Loading loads images as the visitor scrolls them into view.

Once the plugin is installed, users can toggle the modules on or off. Optimizing the site’s CSS can be a lengthy process but it shows a progress bar and alerts you if are trying to navigate away from the page before it’s finished. Jetpack Boost displays an initial score when it’s first installed and will update after optimizations are put in place.

Here’s an example score from a relatively unoptimized simple blog with 20 active plugins:

After installing Jetpack Boost, there was a significant improvement on scores in the dashboard. It’s not a magic wand but it’s a fairly user-friendly way to tackle some basic performance issues that may translate into a better visitor experience.

Checking the before and after scores on web.dev demonstrates a noticeable improvement on the Core Web Vitals assessment. For some websites this could mean the difference between passing or not (meaning 75% of pages on the domain pass).

Before installing Jetpack Boost
After installing Jetpack Boost

Automattic engineer Nauris Pūķis, who worked on the project, said one reason the plugin was created was to help users “get their Web Vitals up and make the web a better place.”

Google Search will be adding Page Experience to ranking signals in May 2021, and WordPress sites need all the help they can get. Page Experience is measured by a website’s Core Web Vitals metrics, but these scores are not easy to improve without some technical knowledge and troubleshooting.

Despite Jetpack already including so many different, varied features, Automattic opted to put the Boost modules in a separate plugin.

We want Jetpack Boost to have a life of its own – focused on performance and make it available to everyone, including people who don’t want to use the main Jetpack plugin,” Pūķis said.

The plugin was built with the same modular structure as Jetpack core, so users can easily deactivate modules they don’t want to use. This is helpful for ensuring compatibility with other performance or caching plugins that website owners may already be using.

“You’ve probably noticed that both Jetpack and Boost have lazy loading images – it’s the exact same module,” Pūķis said. “If the user happens to have both Jetpack and Jetpack Boost active – it’ll just use the most recent version of Lazy Loading Images.”

The features in version 1.0 are just the beginning of Automattic’s plans for Jetpack Boost. The project appears to be on track to become a full-blown performance plugin that may even migrate some of Jetpack core’s performance-related functionality.

“Version 1.0.0 is being released the “one-point-oh” way,” Pūķis said. “We’re releasing as early as we can call it stable – but there’s so much that we want to do. Starting with simple modules that package up other typical optimization techniques (like concatenation, minification, maybe even photon?) – all the way to more advanced ideas like performance tracking, intelligent performance suggestions, etc.”

Pūķis said none of these ideas are set in stone and the team is open to exploring and building modules that will have the highest performance impact after getting more feedback.

How to Optimize Core Web Vitals for WordPress (Ultimate Guide)

Do you want to optimize core web vitals for WordPress?

Core Web Vitals is an initiative by Google which helps website owners improve user experience and quality of their websites. These signals are crucial for the success of any website.

In this guide, we’ll show you how to easily optimize Google Core Web Vitals for WordPress without any special technical skills.

Optimizing Google Core Web Vitals for your WordPress website

Here is a quick overview of what we’ll cover in this guide.

What are Google Core Web Vitals?

Google Core Web Vitals are a set of website performance metrics that Google considers important in a website’s overall user experience. These web vital scores will be a part of Google’s overall page experience score that will impact your SEO rankings.

The truth is that nobody likes a slow-loading website including Google.

Even if your website loads fast, it may not be fully functional for users to do what they want to do or access the information they need.

This is what Web Vitals helps you measure. How quickly does your website loads, becomes visible, and is ready for your users?
Core web vitals

To do that, Google uses three quality tests (Web Vitals).

  • Largest Contentful Paint (LCP)
  • First Input Delay (FID)
  • Cumulative Layout Shift (CLS)

Now the names of these tests may sound too technical but what they do is quite easy to understand.

Let’s see how each Web Vitals test works, what they measure, and how you can improve your score..

Largest Contentful Paint – LCP

Largest Contentful Paint or the LCP, looks for how quickly the main content (whether it is an image, article, or description) becomes visible to the users.

For example, your website might load fast, but the largest content may not appear on the screen as quickly as the rest of the page.

Other speed test tools will give you a high score, but from user’s point of view, the page is still slow.

This is why Google measures the LCP as part of their web vital score, so website owners can have a more clear understanding.

First Input Delay (FID)

First Input Delay (FID) measures the time it takes a user’s browser to actually be able to begin processing event handlers in response to a user’s interaction.

In plain english, let’s suppose a user is on your contact form page. They fill out the form and click on the Submit button. FID, will measure how quickly your website processes that interaction.

An even simpler example would be the time from when a user clicks on a link to the time their browser starts processing the next sequence of events.

Cumulative Layout Shift (CLS)

Cumulative Layout Shift (CLS) measures the time it takes for a website to become visually stable.

As a website loads, some elements take more time to load than others. During this time, your website’s content may keep moving on the screen.

For instance, if a user is reading a paragraph on a mobile device and a video embed loads above it, this makes the entire content move down. This can be really frustrating if a user was trying to accomplish an action such as adding a product to cart where the button shift down due to other items moving on the page.

How to Test Your Google Core Web Vitals Score

The easiest way to test your Google Core Web Vitals Score is by using the Page Speed Insights tool. Simply enter the URL you want to test and click on the Analyze button.

Using Page Speed Insights tool to view the core Web Vitals score

The core vital results are displayed under the section titled ‘Field Data’ section.
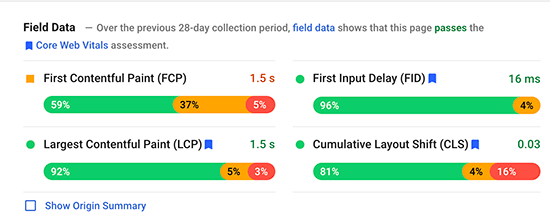
Core Web Vitals report example

To make it simpler, you will see a message at the top saying ‘[…] field data shows that this page passes the Core Web Vitals assessment’.

In the chart below, you can view the actual score of all three core vitals. Here is how much you need to score to pass the core Web Vitals tests for each item.

  • Largest Contentful Paint (LCP) – 2.5 seconds
  • First Input Delay (FID) – Less than 100 milliseconds
  • Cumulative Layout Shift (CLS) – Less than 0.1

How to View Google Core Web Vitals for Full Website?

Now Page Speed Insights tool allows you to check an individual page. If the page you are checking is the root of your domain name, then you can also click on the ‘Show Origin Summary’ checkbox.
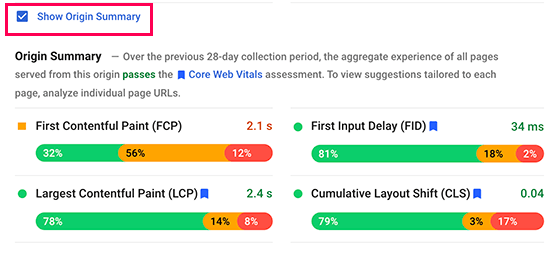
Origin Summary Score

This will show you the score for all pages served from this origin.

However, to really drill down deep, you can access the Core Web Vitals report in your Google Search Console dashboard as well.
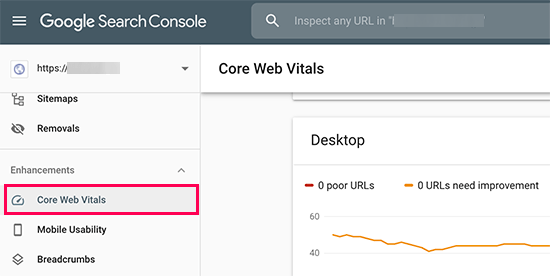
Core web vitals in Google Search Console

This allows you to see how many URLs on your website passed the tests, which URLs need improvement, and which pages have a poor score.

To get even more detailed reports for Web Vitals, you can use the lighthouse speed test by going to Web.dev Measure tool, or by using the built-in test inside Google Chrome browser.

Simply open a website in Chrome, right click anywhere on the screen, and then select the Inspect option. In the tabs, you will see an option called Lighthouse.
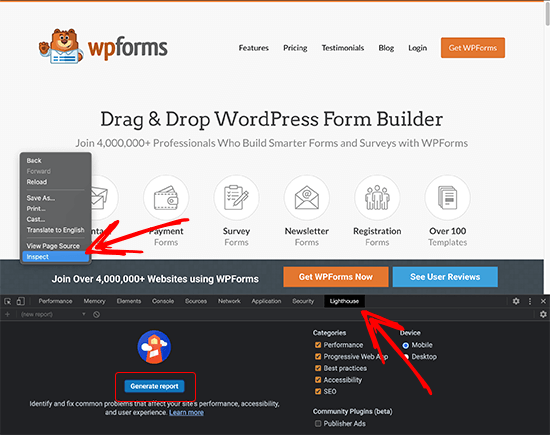
Test Web Vitals in Google Chrome

After that, click the Generate Report button.

Note: You must do the Chrome test in Incognito mode for the most accurate results. Otherwise your browser extensions may negatively impact the core web vital score it shows you.

Why are Core Web Vitals Important?

Core Web Vitals are important because they reflect how your website performs for the users. It is focused not just on the faster loading of a website but on how quickly users can actually use it.

According to a recent study, a 1 second delay in page load time can lead to 7% loss in conversions, 11% fewer page views, and 16% decrease in customer satisfaction.
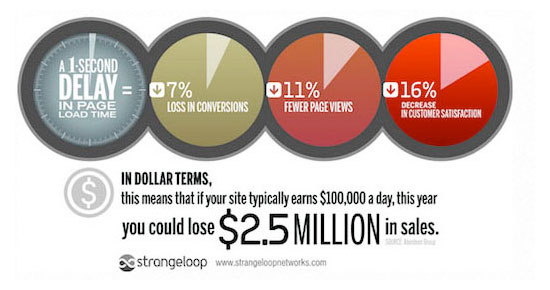
StrangeLoop study

That’s why it is crucial to optimize your website for speed and performance. However, most performance measuring tools didn’t really account for the quality of user experience.

A faster website with poor user experience is still costing you conversions, fewer page views, and poor customer satisfaction. Improving core Web Vitals helps you remedy that.

User experience is also an important factor in SEO rankings. Google has already announced that starting in May 2021 the search algorithm update will include page experience as one of the ranking factors.

That being said, let’s see how you can easily improve your core Web vitals to offer a better user experience on your website.

How to Improve Your Core Web Vitals in WordPress (7 Tips)

Improving your core Web Vitals score in WordPress is not that difficult. Using some essential performance optimization tips you can easily pass the Web Vitals score.

1. Optimize Your WordPress Hosting

Your WordPress hosting company plays the most significant role in your website’s performance.

They are able to optimize their servers for WordPress which gives your website rock-solid platform to build upon.

We recommend using SiteGround for a high-performance website. They are one of the officially recommended WordPress hosting companies, and we use SiteGround for WPBeginner website.

SiteGround

To give your website the performance boost it needs, SiteGround uses Google Cloud Platform for their servers along with ultrafast PHP.

Their SG Optimizer plugin is used by over a million websites. It automatically makes further performance enhancements and turns on built-in caching which does everything WP Rocket does and more.

It’s important to note, that their SG Optimizer plugin only works on SiteGround hosting accounts, and these performance optimizations are available for all plans including the lowest option.

If you’re using another WordPress hosting provider, then we recommend using WP Rocket along with few other tools to achieve better core web vitals score.

WP Rocket is the best WordPress caching plugin on the market. It allows you to easily set up caching on your WordPress website without going into any technical details of server management.

2. Improving Largest Content Paintful (LCP) Score

As mentioned earlier, the Largest Content Paintful (LCP) is literally the largest content part within the viewport of a page. For instance, on a blog post, this could be the featured image or the article text.

The quicker this content loads the higher your LCP score would be.

How do you know which content is considered the largest by the test? Well, you need to scroll down to the test results and expand the ‘Largest Contentful Paint element’ tab.
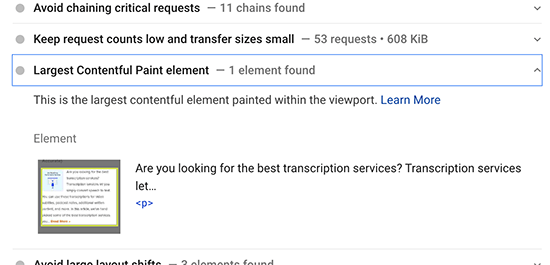
Largest Content Paintful element

You’ll see the elements considered for the LCP score. If it is a larger image, then you can try replacing it with a smaller image or an image with lower file size and quality. See our guide on how to optimize images for web performance.

If it is text, then you can try breaking it into paragraphs and headings.

3. Improving First Input Delay (FID) Score

First Input Delay score measures the time between a user clicking on something on your website and their browsers starting processing elements.

The most important tip to improve that is by using a better web hosting or even managed WordPress hosting platform.

Another easy way to improve FID score is by using a caching plugin like WP Rocket. It comes with a built-in feature that allows you to optimize file delivery.

First you would need to install and activate the WP Rocket plugin. For more details, see our step by step guide on how to install a WordPress plugin.

After that, go to Settings » WP Rocket page and switch to the File Optimization tab.
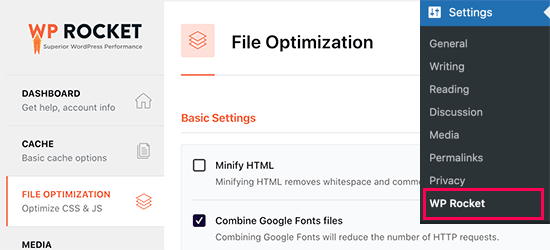
File Optimization in WP Rocket

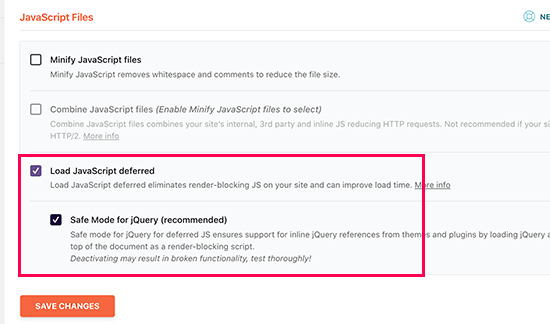
Scroll down to the bottom of the page and check the box next to the ‘Load JavaScript deferred’ option.
Defer JavaScript

Don’t forget to click on the Save Changes button to store your changes.

Deferring JavaScript allows your website to load without waiting for JavaScript to be loaded. This improves First Input Delay (FID) Score for pages where JavaScript may be the cause.

4. Improving Cumulative Layout Shift (CLS) Score

Cumulative Layout Shift (CLS) score is affected when different elements on a web page are loading slowly and making other elements on the screen move.

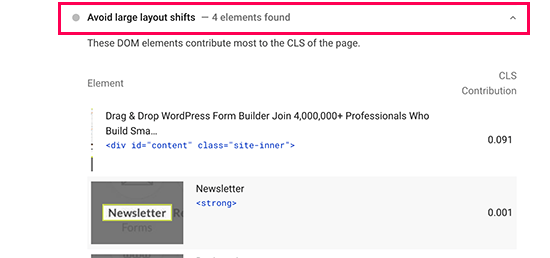
You can view which elements are affecting the CLS score by expanding the ‘Avoid large layout shifts’ tab in the Page Speed Insights results.
Layout shift elements

This will show you the elements that are causing the most layout shift impact during page load.

To make sure that the visual layout of your page does not shift as other items load, you need to tell browsers about the dimensions (width and height) of the elements like images, video embeds, Ads such as Google AdSense, and more.

WordPress automatically adds height and width attributes to images you add. However, you can still check all other media particularly embeds to make sure that all of them have height and width attributes.

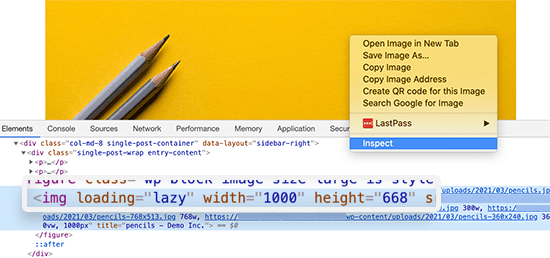
One way to do that is by using the Inspect Tool. Simply right-click in your browser and select Inspect to open the developer console.

You can then point and click on different page elements to highlight their source code. There, you can see if the element has width and height attributes defined.
Inspect height and width attributes

5. Eliminate Render Blocking Elements

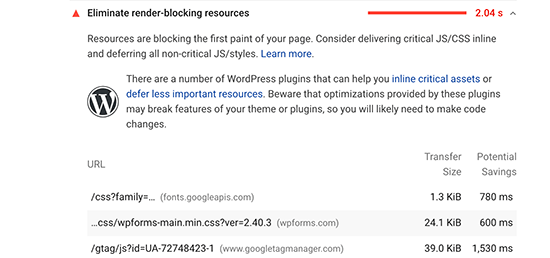
Render blocking elements are the elements that are slower to load but are blocking other elements from loading first. This affects your overall Web Vitals score and user experience on your website.

Page Speed Insights results will show you the render blocking elements. These are usually JavaScript or CSS files added by your WordPress plugins, third-party tools like Google Analytics, Facebook Pixel, Google Ads, and more.
Render blocking elements

However, most such elements are programmatically added to your site by different plugins or theme. This makes it harder for a beginner user to remove or properly load them.

We have a step by step guide on how to easily eliminate render blocking elements in WordPress without messing with any code on your website.

6. Properly Size Images in WordPress

Another common cause of lower core Web Vitals score is very large images. Many WordPress users upload high-resolution images to their websites which take longer to load and in most cases are not necessary.

Optimized vs Unoptimized Images in WordPress

This becomes even more problematic for users on mobile devices. Your responsive WordPress theme and WordPress will automatically fit the image to user’s mobile screen but they would still be loading a larger file.

We have a detailed guide on how to properly optimize images for your WordPress website without losing quality or affecting the performance.

7. Use a CDN to Server to Improve Web Vitals Score

CDN or content delivery network are third-party services that allow you to serve static content of your website from multiple servers around the globe.

This allows users to download those static files like images and CSS from servers that are nearest to them. It also reduces load on your website which can then continue loading other elements.

You can use a cloud firewall app like Sucuri which comes with a built-in CDN service. Sucuri also helps you block malicious and spam requests which further frees up your website resources.

You can also use Cloudflare free CDN as an alternative. It comes with a basic firewall protection and CDN service that would improve your website’s web vitals score.

We hope this guide helped you learn how to optimize core web vitals for WordPress. Another important aspect of good user experience is security. We recommend that you follow our WordPress security checklist to make sure that your website performance is not affected by spam or DDoS attacks.

You may also want to see our comparison of best video editing software and best webinar platforms to create performance optimized media content that doesn’t slow down your website speed.

If you liked this article, then please subscribe to our YouTube Channel for WordPress video tutorials. You can also find us on Twitter and Facebook.

The post How to Optimize Core Web Vitals for WordPress (Ultimate Guide) appeared first on WPBeginner.

Collective #646


Collective 646 Item Image

How We Improved SmashingMag Performance

In this article, you’ll learn about the changes made on Smashing Magazine — running on JAMStack with React — to optimize the web performance and improve the Core Web Vitals metrics.

Read it


Collective 646 Item Image

Wldlght

Follow an amazing journey in Japan with this projection mapping project, Wldlght.

Check it out


Collective 646 Item Image

Formality

A designless, multistep, conversational, secure, all-in-one WordPress forms plugin.

Check it out


The post Collective #646 appeared first on Codrops.

Measuring Core Web Vitals with Sentry

Chris made a few notes about Core Web Vitals the other day, explaining why measuring these performance metrics are so gosh darn important:

I still think the Google-devised Core Web Vitals are smart. When I first got into caring about performance, it was all: reduce requests! cache things! Make stuff smaller! And while those are all very related to web performance, they are abstractly related. Actual web performance to users are things like how long did I have to wait to see the content on the page? How long until I can actually interact with the page, like type in a form or click a link? Did things obnoxiously jump around while I was trying to do something? That’s why Core Web Vitals are smart: they measure those things.

There’s certainly a lot of tools out there that help you measure these extremely important metrics. Chris’ post was timely because where I work at Sentry¹, we’re launching our own take on this. My favorite once-a-year-blogger and mentor at Sentry, Dora Chan, explained why using real user data is important when it comes to measuring Web Vitals and how our own product is approaching it:

Google Web Vitals can be viewed using the Google Chrome Lighthouse extension. You may be asking yourself, “Why would I need Sentry to see what these are if I already have Google?” Good question. Google provides synthetic lab data, where you can directly control your environment, device, and network speed. This is good and all, but it only paints part of the picture. Paint. Get it?

Sentry gathers aggregate field data on what your users actually experience when they engage with your application. This includes context on variable network speed, browser, device, region, and so forth. With Web Vitals, we can help you understand what’s happening in the wild, how frequently it’s happening, why, and what else is connected to the behavior.

Sentry breaks down all these transactions into the most important metrics so you can see how your customers are experiencing performance problems. Perhaps 42% of the time a transaction has an input delay of more than 301ms. Sentry would show that problem and how it correlates with other performance issues.

A screenshot of the Sentry interface shows a two-column table with five rows that show the performance metrics in the left column and a brightly colored bar chart illustrating the metric in the right column. The metrics include FIP, FCP, LCP, FID and CLS.

I think this is the power of tying Core Web Vitals with user data — or what Dora calls “field data” — because some of our users are experiencing a fast app! They have great wifi! All the wifis! That’s great and all, but there are still users on the other side who put up with a more miserable experience, and having a visual based on actual user data allows us to see which specific actions are slowing things down. This information is what gives us the confidence to hop into the codebase and then fix the problem, but it also helps prioritize these problems in the first place. That’s something we don’t really talk about when it comes to performance.

What’s the most important performance problem with your app right now? This is a trickier question than we might like to admit. Perhaps a First Paint of five seconds isn’t a dealbreaker on the settings page of your app but three seconds on the checkout page is unbearable for the business and customers alike.

So, yeah, performance problems are weird like that; the same result of a metric can mean different things based on the context. And some metrics are more important than others depending on that context.

That’s really why I’m so excited about all these tools. Viewing how users are experiencing an app in real time and then, subsequently, visualizing how the metrics change over time — that’s just magic. Lighthouse scores are fine and dandy, and, don’t get me wrong, they are very useful. They’re just not an extremely accurate measure of how users actually use your app based on your data.

This is where another Sentry feature comes into play. After you’ve signed up and configured everything, head to the Performance section and you’ll see which transactions are getting better over time and which have regressed, or gotten slower:

A screenshot of the sentry Performance dashboard. There is a dark purple sidebar to the left that acts as the app's navigation and the Performance link is active. The screen displays two charts side-by-side in separate cards that measure most improved transactions and most regressed transactions. Both are line charts with time on the Y-axis and date on the X-axis. A list of highest and lowest performers are displayed beneath each chart respectively.

Tony Xiao is an engineer at Sentry and he wrote about how he used this feature to investigate a front-end problem. That’s right: we use Sentry to measure our Sentry work (whoa, inception). By looking at the Most Regressed Transactions report, Tony was able to dig into the specific transaction that triggered a negative result and identify the problem right then and there. Here’s how he described it:

To a fault, code is loyal to its author. It’s why communicating with your code is critical. And it’s why trends in performance monitoring is so valuable: it not only helps you understand the ups and downs, but it can help point you in the right direction.

Anyway, I’m not really trying to sell you on Sentry here. I’m more interested in how the field of front-end development is changing and I think it’s super exciting that all of these tools in the industry are coming together at this moment in time. It feels like our understanding of performance problems is getting better — the language, the tools, the techniques are all evolving and a tide is turning in our industry.

And that’s something to celebrate.

  1. Yes, I do work at Sentry but this is not a sponsored post. The topic of Core Web Vitals just so happens to be something I’m paying attention to and I had some follow-up thoughts after reading the post by Chris. ↩️


The post Measuring Core Web Vitals with Sentry appeared first on CSS-Tricks.

You can support CSS-Tricks by being an MVP Supporter.

Core Web Vital Tooling

I still think the Google-devised Core Web Vitals are smart. When I first got into caring about performance, it was all: reduce requests! cache things! Make stuff smaller! And while those are all very related to web performance, they are abstractly related. Actual web performance to users are things like how long did I have to wait to see the content on the page? How long until I can actually interact with the page, like type in a form or click a link? Did things obnoxiously jump around while I was trying to do something? That’s why Core Web Vitals are smart: they measure those things.

The Lighthouse Tab in Chrome DevTools has them now:

They are nice to keep an eye on, because remember, aside those numbers having a direct benefit for your users once they get to your site, they might affect users getting to your site at all. Web Core Vitals are factoring into SEO and for the new carousel requirements that were previously reserved only for AMP pages.

Tracking these numbers on one-off audits is useful, but more useful is watching them over time to protect yourself from slipping. Performance tooling like Calibre covers them. New Relic has got it. SpeedCurve tracks them.

Cumulative Layout Shift (CLS) is a tricky one. That’s the one where, say, the site has an advertisement at the top of an article. The request for that ad is asynchronous, so there is a good chance the ad comes in late and pushes the content of the article down. That’s not just annoying, but a real ding to performance metrics and, ultimately, SEO.

Nic Jansma’s “Cumulative Layout Shift in Practice” offers deep dive.

CLS isn’t just “does page do it or not?” There is a score, as that illustration above points out. I’d say 0 is a good goal as there is no version of CLS that is good for anybody. There is lots of nuance to this, like tracking it “synthetically” (e.g. in a headless browser, especially for performance tooling) and with real users on your real site (which is called RUM, or Real User Metrics). Both are useful.

If you’ve got CLS that you need to fight, that can be tricky. SpeedCurve has some new tooling that helps:

For each layout shift, we show you the filmstrip frame right before and right after the shift. We then draw a red box around the elements that moved, highlighting exactly which elements caused the shift. The Layout Shift Score for each shift also helps you understand the impact of that shift and how it adds to the cumulative score.

That would make it pretty easy to root out and fix, I’d hope. Particularly the tricky ones. I didn’t know this, but CLS can be caused by far more subtle things which Mark Zeman points out in the post. For example:

  • An image carousel that only moves horizontally can trigger CLS. That feels like a bummer as that’s what they are supposed to do, but apparently, you can trick it by moving carousels only with CSS transform.
  • If you have a very large area, that’s extra risky to move. If it moves just a smidge, it will affect CLS by a lot.
  • Flash of Unstyled Text (FOUT) is a cause of CLS. Even though that’s good for performance for other reasons! Catch 22! It’s a good excuse to reach for perfect font fallbacks.

Tricky, yet important stuff. I really need to get performance tests into my CI/CD, which will really help with this. Feels more and more like web performance is a full-on career subgenre of web development. Front-end web developers really need to understand this stuff and help to some degree, but we’ve already got so much to do.


The post Core Web Vital Tooling appeared first on CSS-Tricks.

You can support CSS-Tricks by being an MVP Supporter.

Core Web Vitals

Core Web Vitals is what Google is calling a a new collection of three web performance metrics:

  1. LCP: Largest Contentful Paint
  2. FID: First Input Delay
  3. CLS: Cumulative Layout Shift

These are all measurable. They aren’t in Lighthouse (e.g. the Audits tab in Chrome DevTools) just yet, but sounds like that’s coming up soon. For now, an open source library will get you the numbers. There is also a browser extension (that feels pretty alpha as you have to install it manually).

That’s all good to me. I like seeing web performance metrics evolve into more meaningful numbers. I’ve spent a lot of time in my days just doing stuff like reducing requests and shrinking assets, which is useful, but kind of a side attack to web performance. These metrics are what really matter because they are what users actually see and experience.

The bigger news came today though in that they are straight up telling us: Core Web Vitals matter for your SEO:

Today, we’re building on this work and providing an early look at an upcoming Search ranking change that incorporates these page experience metrics. We will introduce a new signal that combines Core Web Vitals with our existing signals for page experience to provide a holistic picture of the quality of a user’s experience on a web page.

Straight up, these numbers matter for SEO (or they will soon).

And they didn’t bury the other lede either:

As part of this update, we’ll also incorporate the page experience metrics into our ranking criteria for the Top Stories feature in Search on mobile, and remove the AMP requirement from Top Stories eligibility.

AMP won’t be required for the SERP carousel thing, which was the #1 driver of AMP adoption. I can’t wait to see my first non-AMP page up there! I know some features will be unavailable, like the ability to swipe between stories (because that relies on things like the Google AMP cache), but whatever, bring it on. Let AMP just be a thing people use because they want to, and not because they have to.

The post Core Web Vitals appeared first on CSS-Tricks.

Speed Report replaced by Core Web Vitals

As of this morning, the Speed Report (Experimental) in Google Search Console has been replaced by a more robust Core Web Vitals report.

It still is broken up into a Mobile and Desktop version. However, instead of just monitoring FCP (First Contentful Paint) and FID (First Input Delay), it now seems to monitor CLS and LCP ... or at least those are the issues it's flagging for my site.

Issue type is the status of the various measures:

LCP (largest contentful paint): How long it takes the page to render the largest visible element
FID (first input delay): How long it takes the page to start responding to user actions
CLS (cumulative layout shift): How much the page UI shifts during page loading.

Speed issues are assigned separately for desktop and mobile users.

As you may recall, the experimental Speed Report was disallowing any revalidation because of an alert message saying that it would be changing soon. Well it looks like it's here!

Is anyone else seeing this yet?