In Part I we looked at the advantages of building a data warehouse independent of cubes/a BI system and in Part II we looked at how to architect a data warehouse’s table schema. Today we are going to look at where to put your data warehouse tables.
Oracle Cloud applications are gaining space in the industry at a fast pace and as more implementations happen in Oracle Cloud, it has become important to query the data in the cloud and develop reports based on business requirements. Here are the steps to develop a cloud BI Report:
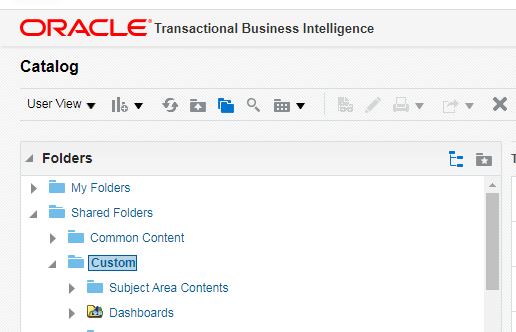
Login to Oracle Cloud Applications and Go to Tools in the Navigator and click on Reports and Analytics. Click on Browse Catalog to launch the BI workspace.
Select the "Custom" folder to create your own folder to keep reports.
The latest analytical tools, including AI, machine learning, working with natural language, are being used now across all industries. BI helps professionals and ordinary employees working with information to automate many aspects of data research, as well as the development and use of data models. Let’s discover how AI is revolutionizing BI with machine learning algorithms and natural language processing.
AI and BI Symbiosis
Today, there are practically no separate solutions to adjust the analysis of cross-cutting indicators that evaluate the work of several departments and their relationship (including implicit) of an enterprise. AI does not need formulas and algorithms - this is its serious advantage over classical systems. It can fast enough, based only on statistics, perform monitoring of indicators determining implicit relationships and dependencies that affect the work of the entire company.
Do you know why microservice design is so popular within the development of BI tools? The answer is clear: it helps to develop scalable and flexible solutions. But microservice architecture has a great drawback. Its performance usually requires great improvements.
The FreshCode team also faced the problem and I’ve decided to show how we coped with it. The article is written together with FreshCode CTO and based on our recent case of development reporting microservice. You will find here its tech scheme, estimates, as well as a list of tools for on-premise and SaaS products.
I recently joined OmniSci as a Community Developer Advocate. My role is to help build the global OmniSci community and raise awareness through presentations and technical writing. My background is in database technology, but I don't have any previous experience with OmniSci or Graphics Processing Unit (GPU) technology. In this series of articles, I will share what I learned about OmniSci as a beginner and I hope that this will also be useful to other beginners. I will focus mainly on Open Source Software (OSS) and industry standards.
What Is OmniSci?
At its heart, OmniSci is an analytics platform that can process very large quantities of data at scale. As shown in Figure 1, OmniSci consists of a number of components in three major groupings: Data Integration, OmniSci Platform and Develop and Accelerate.
The era of data analysis has already arrived. From the state, government, and enterprises to individuals, big data and data analysis have become trends that everyone is familiar with. But you may not have the professional knowledge of data analysis and programming, or you have learned a lot about the theory of data analysis, but you still can't practice it. Here, I will compare the four tools that are most popular with data analysts, Excel, R, Python, and BI, as the basis for getting started with data analysis.
1. Excel
1.1 Usage Scenarios
Data processing work under general office requirements.
Data management and storage of small and medium-sized companies.
Simple statistical analysis for students or teachers (such as analysis of variance, regression analysis, etc.).
Combine Word and PowerPoint to create data analysis reports.
Assistant tool of data analysts.
Production of charts for some business magazines and newspapers (data visualization).
1.2 Advantages
It's easy to get started with Excel.
The learning resources are very rich.
You can do a lot of things with Excel: modeling, visualization, reports, dynamic charts, etc.
It can help you understand the meaning of many operations before further learning other tools (such as Python and R).
1.3 Disadvantages
To fully master Excel, you need to learn VBA, so the difficulty is still very high.
When the amount of data is large, there will be a situation of stuttering.
The Excel data file itself can hold only 1.08 million rows without the aid of other tools, and it's not suitable for processing large-scale data sets.
The built-in statistical analysis is too simple and has little practical value.
Unlike Python, R, and other open source software, there is a charge for the genuine Excel.
2. R
2.1 Usage Scenarios
The functions of R cover almost any area where data is needed. As far as our general data analysis or academic data analysis work is concerned, the things that R can do mainly include the following aspects.
For a pretty decent amount of time, doing analytics with MongoDB required additional overhead compared to modern SQL RDBMS and Data Warehouses associated with aggregation pipeline and MapReduce practices. While this approach allowed you to craft advanced custom tailored aggregation algorithms, it required additional knowledge of how to build and maintain it.
To fill this gap, MongoDB released the MongoDB connector for BI, which acts as a MySQL server on top of your MongoDB data. Under the hood, it bridges existing aggregation mechanisms to the MySQL protocol, allowing standard MySQL clients to connect and issue SQL queries.
As we said in our introductory post, we’re going to do several posts about Zoomdata microservices. This one covers a brief overview of microservices and the Zoomdata web application.
Zoomdata Microservices, In General
The Zoomdata platform is architected as a set of loosely-coupled Java microservices. Unlike traditional BI, which is deployed as a monolithic application (or possibly entwined in an old-school enterprise service bus), a microservices architecture allows for: