How to Debug Microservices in the Cloud

The growth in information architecture has urged many IT technologies to adopt cloud services and grow over time. Microservices have been the frontrunner in this regard and have grown exponentially in their popularity for designing diverse applications to be independently deployable services.

Trivia: In a survey by O'Reilly, over 50% of respondents said that more than 50% of new development in their organisation utilise microservices.

Observability and AIOps: The Perfect Combination for Dynamic Environments

IT teams live in dynamic environments and continuous integration/continuous delivery has been in high demand. In the dynamic environment, DevOps and underlying technologies such as containers and microservices, continue to grow more dynamic, and complex. Now, just like DevOps, observability has become a part of the software development life cycle.

With basic monitoring techniques, ITOps and DevOps teams lack the visibility to support the explosive growth in data volumes that arise in these modern environments. And, that’s also because they cannot scale with manual processes. Traditional monitoring systems focused on capturing, storing, and presenting data generated by underlying IT systems. Human operators were responsible for analyzing the resulting data sets and making necessary decisions, making the IT processes human-dependent.

Beyond Observability: Putting Intelligence in Modern Monitoring

If you’re paying attention to anything that’s happening in the development world, you’re likely familiar with the term “observability.” We’re seeing more and more monitoring companies from all different backgrounds jumping on the term to describe their solutions, many claiming their observability tool to be the factor that will take businesses to the next level.

Growing out-of-control system engineering, observability allows dev teams to unify and study the behaviors of various IT systems through the external outputs of the internal systems. In the case of software, that’s log events, distributed tracing, and time-series metrics. By unifying the data streaming through today’s complex IT environments, it certainly gives SREs and DevOps practitioners a leg up from traditional monitoring. But the data alone is no longer enough.

Cloud-Native Observability With WSO2 Micro Integrator

In a distributed systems environment, troubleshooting and debugging are critical and also very challenging tasks. WSO2 Micro Integrator offers the possibility to integrate with cloud-native monitoring tools in order to provide a comprehensive observability solution with log monitoring, message tracing, and metrics monitoring.

With WSO2 MI we have two approaches to help us deal with observability:

Observability Vs. Monitoring: Why A Developer Needs Both

Observability Vs. Monitoring: Why A Developer Needs Both

Given the complexity of distributing the evolving cloud-based services and infrastructures across a diverse range of users, IT service providers consistently observe and monitor metrics, datasets, and logs. Establishing system reliability and the predictability of backend IT infrastructure operations all spawn from systems observability and monitoring.

Software solutions often deliver a wide range of IT infrastructures and services from distant geographical locations to companies — in the semblance of cloud-based services such as containers and microservices. These services are distributed across multiple layers of infrastructure and platform services.

Monitoring vs Observability

Monitoring vs. observability: Is there even a difference and is your monitoring system observable?

Observability has gained a lot of popularity in recent years. Modern DevOps paradigms encourage building robust applications by incorporating automation, Infrastructure as Code, and agile development. To assess the health and “robustness” of IT systems, engineering teams typically use logs, metrics, and traces, which are used by various developer tools to facilitate observability. But what is observability exactly, and how does it differ from monitoring?

5 Principles of Production Readiness

Ever wondered how to tell if an application is ready for production? What if I tell you that you can do this just by using five simple principles? Using just these five principles, you can assess your app’s readiness, and you don’t have to be technical to get them either. Well, let’s see what these principles are and how they can make your life easy.

Production readiness refers to when a certain application or a program will be ready to operate. Usually, if you are a developer, you will have to create a product life-cycle and develop a product yourself. Once the application is made, we call it a production-ready application. At this point, the application should be capable of handling production-level traffic, data and security.

How to Optimize AWS Observability Tools

Amazon Web Services (AWS) is a powerhouse cloud computing service allowing companies to produce computational functionality. They enable developers to quickly create serverless functions, which quickly delivers new features to consumers without scaling up infrastructure, taking both time and cost. The downside to this speed is that tracking and observing these functions’ health issues can be difficult, especially when running microservices. AWS provides several tools to assist developers in understanding their system’s health and are in the process of delivering new tools as well.

Observability With AWS CloudWatch

CloudWatch is AWS’s monitoring and insight service. Developers use CloudWatch to collect logs from compute functions and track performance information for many AWS services. Using this data, CloudWatch can create insights on which developers can develop alarms or insights. Using the combination of these tools, developers can create AWS observability tools that meet their needs.

How Observability and AI Support DevOps’ New Way of Working

Throughout the last few years, the traditional tasks of a DevOps practitioner have evolved to focus less on keeping the lights on and more on adding value to the customer experience. This, in part, is because automation has taken over some of the mundane, daily tasks presented by old monitoring systems. But new solutions have emerged that support the new way of working for DevOps practitioners — bring in intelligent observability, or observability and AI. 

Observability takes data from complex environments to infer from the outside what’s happening on the inside, i.e.: giving developers insight into what’s happening and where. But that’s not enough information to show what action needs to be taken, who is responsible, and how to prevent future incidents. With observability and AI, or intelligent observability, DevOps practitioners experience a whole new way of working. They can automate system monitoring, act quickly on insights into the issues that need attention, and understand what needs to be done to resolve incidents because they now understand why they happen. 

An Observability Balancing Act With GitOps

As companies intensify their push toward adopting DevOps practices and cultural values, there are several practical methodologies cropping up. One such concept is GitOps, which stems from the DevOps need to automate everything and the philosophy of you build it you run it.

The fear of losing out to the competition warrants the need to be agile which then leads to a retrospective of how teams and organizations are getting code from ideation to production. DevOps! The motivation is simple: The faster the release, the more chances of securing the survival of your product in the fast-paced world of technology. 

How to Properly Deprecate APIs

As with any product lifecycle, a key responsibility for API architects and API product owners is deciding when to sunset or retire a feature or offering. The API lifecycle is no different, but requires careful planning to carry out the deprecation to minimize customer impact. Unlike a packaged solution or module which is more of a black box, APIs enable your customers to build custom functionality which may have requires months of integration work and testing. Without the correct assessment or process, you could prematurely deprecate a critical service causing a storm of support tickets.

This guide walks through the best practices of deprecating an endpoint and shows, by example, how to do it with an analytics platform.

Trends Influencing DevOps/DevSecOps Adoptions

Essentially a set of practices coupling software development (Dev) and information technology operations (Ops), DevOps is the combination of employees, methods, and products to allow for perpetual, seamless delivery of quality and value to the clients.

Adding to a set of DevOps practices, a DevSecOps approach provides multiple layers of security and reliability to the clients by integrating highly secure, robust, and dependable processes and tools into the work cycle and the product.

What Is Cloud Native Observability V. Visibility and Why Is It So Important?

Cloud-native technologies are revolutionary and disruptive to existing infrastructure, application, and monitoring methods that result in opacity problems. We’ll go into more detail as to why the shift to cloud-native observability has arrived, propose a broader, more meaningful definition of what it is, the resulting significance, and deeper implications. But first, let’s revisit containerization, and by extension, why cloud-native observability is so important.

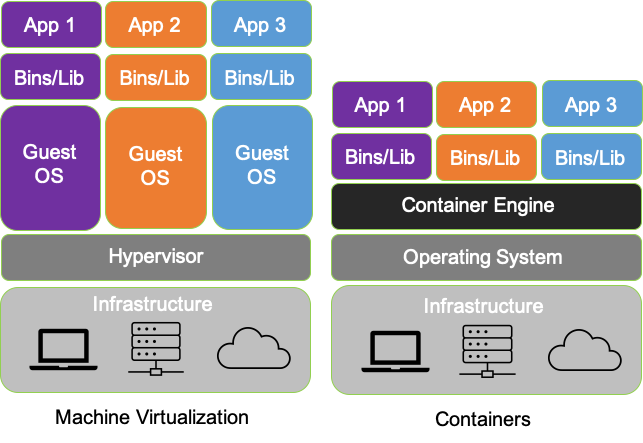
Virtualization and Cloud-Native/Container-Based Systemscloud-native

There is no intervening hypervisor between the OS and the underlying infrastructure in containerized environments, enabling applications and developers to take full advantage of the benefits of cloud-native development and deployment in terms of interoperability, efficiency, and performance. Consequently, in addition to the resulting efficiency and portability advantages, containerization makes it possible to access and use operating system (and kernel) services directly to examine the state and operation of the underlying infrastructure (nodes/bare metal servers), as well as the attendant services, the operating system, and applications. This is profoundly important because in the cloud-native world – network topology (physical and virtual) is hidden, interfaces (network namespaces) are hidden, data flows are hidden, and to make matters even more challenging - resources can be ephemeral - dynamically configured, provisioned, deployed and reused. 

Experiment With OpenTelemetry: Play With the Future Cloud Native Metrics Framework, Now

Everyone loves hooking up 42 different types of observability tooling to all of their infrastructure and apps, right? No? Me neither, and this is why I’m so excited about OpenTelemetry. Not only is OpenTelemetry a specification that all of the observability/monitoring/APM vendors appear to be rallying around, but it’s also a framework of standardized tools, APIs, and SDKs. This truly has the potential to be the one observability standard to rule them all!

Accordingly, we are excited to announce an OpenTelemetry integration in the K8s Initializer project to enable observable application-ready Kubernetes playgrounds. Although the OpenTelemetry observability framework has not yet been given the generally available (GA) label, it’s anticipated exit of beta is just around the corner. We were keen to play around with this tech and figured you would be too.

Why Observability Is the Next Big Thing in Security

Observability for Application Security Is a Must-have

It's not easy to tell modern security stories to users of legacy security solutions still attached to squeezing some fading security value from network-based perimeter walls. Organizations and their application security teams still find it hard to justify the obvious need for true operational change in application development and deployment (cloud adoption sits at 46%), even as software — now in the form of complex, high-velocity, and distributed cloud architectures — continues to rapidly become the only known way to effectively grow a modern business.

Still, the fact is software developers and cross-functional teams will not wait and have simply taken application security away from SecOps because a new paradigm of observability for security purposes has emerged as a core requirement for effective protection of modern applications in the cloud. Today's complex, distributed, and ephemeral challenges brought forward by next-generation cloud adoption are the new critical roadblocks that enterprises must solve to achieve rapid business grow: either adopt a technology stack that delivers observability for security or lack the ability to effectively secure your cloud applications.

Observability 101: Terminology and Concepts

When I first started following Charity on Twitter back in early 2019, I was quickly overwhelmed by the new words and concepts she was discussing. I liked the results she described: faster debugging, less alert fatigue, happier users. Those are all things I wanted for my team! But I was hung up on these big polysyllabic words, which stopped me from taking those first steps toward improving our own observability.

This post is my attempt to help orient folks who want to learn more about observability but maybe feel overwhelmed or intimidated by the vocabulary list, like I did. My goal is to get everyone on the same page about what these words mean so that we can focus on leveraging the tools and ideas to build better software and deliver more value! 

5 Kibana Visualizations To Spice Up Your Dashboard

If you work in any way that is adjacent to data, insight, and analytics, there’s a good chance you will at least have heard of Kibana. If you haven’t then there’s no better time to be jumping on the bandwagon.

An open-source app, Kibana caters perfectly to any enterprise that needs to incorporate data discovery, navigation, and visualization. So long is the list of features and benefits that it’s impossible to cover them all in a single article. Tools like Kibana Lens showcase this beautifully.