Publish Log From Naked Mulesoft Deployment to Graylog

Introduction

In this article, I discuss what Graylog is and how to perform a Naked deployment to a MuleSoft configuration in order to send a log to Graylog. 

MuleSoft Features

MuleSoft supports configuration and dependencies in log4j to publish logs to Graylog from CloudHub and Naked MuleSoft deployments.

RTF Log Forwarding Approaches to Graylog

Agenda 

  • Introduction.
  • MuleSoft RTF Platform.
  • About Graylog.
  • Runtime Fabric Log Forwarding Approaches To Graylog.

Introduction

  • RTF controls Mule runtimes in K8s executed docker containers called pods, all packaged with Gravity (Kubernetes cluster and all its applications into a single file called a "Cluster Image") for the expertise of installation and portability. 
  • A basic condition is to find a way to promote the Mule application logs to 3rd party logging platforms like Graylog to maintain the logs between redeployment or in the event of crashes.
  • Out of the box RTF log forwarding.
  • Third-party agent polling.
  • Hybrid (Unified way of logging where the customer is using both CloudHub as well as RTF).

MuleSoft RTF Platform

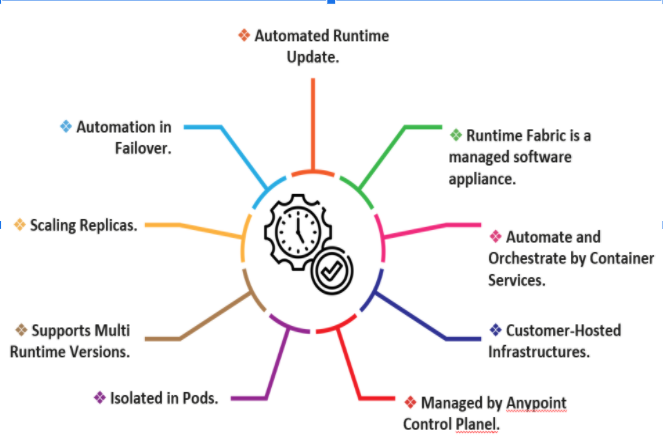
automated runtime

  • Anypoint platform is the main offering that has 2 main components. Management plane, and runtime plane. While creating individual containers while deploying the application in RTF, it keeps runtime independent from others and the same follows for continuous deployments.
  • As it builds an independent runtime container for each application which makes it to handle multi runtime version deployment. 
  • And discussing resource scaling, it supports both horizontal and vertical scaling by simple configuration or easier command to add more resources to existing infrastructure with zero downtime.
  • With its health monitoring and configuration persistence behavior, it adheres to escape from application failover. For instance, if any runtime goes out of service then it replicates another runtime instance to avoid platform failover.

About Graylog

Once messages are being received, it can be poked around and explore a bit. There are several pages available, though not all pages may be visible to all users, depending on individual permissions. The following are a few brief descriptions of each page’s purpose and function.

Components of Effective Software Monitoring: App Logs, Infrastructure Telemetry, Health-Check Reports

At Logicify, we are proud to be software monitoring geeks. We love to monitor both the apps we develop and the ones we use internally. Not because they are sloppy. Not because we don’t trust our code. But because we love to keep abreast of events, control performance and eliminate the risks of an error. Monitoring helps us be proactive and avert issues before real users are affected.

In our double-sided system of user behavior and app condition monitoring, we use Graylog as a single data storage for logs and other data about the web app, and Grafana, a powerful data visualization tool. Combined and wisely configured, these two tools give an objective picture of the app’s performance at all times. For comprehensive snapshots of system behavior and, what is more important for apps in production, for proactive moves to iron troubles out, we collect monitoring data from a multiple layers. App-specific metrics are complemented by other analytics to give a broader picture of system state and performance.
Graylog With Kubernetes in GKE

We all know that when collecting data from different data sources — whether it is an application, server, or service —  it is a necessity to have a tracking system that tells what went wrong with your system at a specific time, and to know exactly how your system behaves. 

This article aims to demonstrate how to deploy The Graylog Stack — Graylog v3 and Elasticsearch v6, along with MongoDB v3 — use Kubernetes, and how to collect data from different data sources using inputs, and streams.