NoCode is a great concept that empowers nonprogrammers to build applications without having to become software developers; however, some people believe that NoCode will eventually replace traditional coding (i.e. that you can build anything on NoCode platforms). If you are starting a project with this mindset, you may end up sorely disappointed.
NoCode is a tool that complements traditional coding within the technology stack of an organization. There are certain types of projects that are ideal for NoCode, while others shouldn’t even be considered.
The formula is the heart of an Excel file. And of course, we all want to do correct calculations and deliver accurate results. When there is something wrong, we want to trace back to those referenced cells to find the root cause. Excel natively has a built-in convenient formula dependent/precedent trace feature, it highlights the dependent/precedent cells and displays arrows to indicate the relationships. This helps users to trace back and find any error formulas easily.
Now, when bringing the spreadsheet online, we can do more. We can display the relationships in a custom way that is most useful according to the application context, or bring them to a different service or application for doing the validation programmatically.
According to the Microsoft website, a macro is a series of commands that you can use to automate a repeated task and can be run when you must perform the task. The use of macro instructions was originally initiated for assembly language programming to perform two main purposes: to reduce the amount of coding that had to be written by generating several assembly language statements from one macro instruction, and to enforce program writing standards.
Nowadays, macros are used for a wide variety of purposes and industries; Microsoft applications currently use Visual Basic for Applications (VBA) programming language to build their macros, and they allow you to choose whether you want to enable or disable existing macros from use. However, when Microsoft was first designing macro features for the Microsoft Office suite, they weren’t thinking about potential internet security risks.
Excelize is a library written in pure Go providing a set of functions that allow you to write to and read from XLSX / XLSM / XLTM files. Supports reading and writing spreadsheet documents generated by Microsoft Excel™ 2007 and later. Supports complex components by high compatibility, and provided streaming API for generating or reading data from a worksheet with huge amounts of data. This library needs Go version 1.10 or later.
SQL is replacing Excel in many fields, and data analysis is certainly one of them. If you are still using Excel as a data analyst, you are missing something very valuable. SQL can make your life easier, as it’s more efficient and faster than Excel. How and from where can you learn SQL?
Many companies have operated their business with Excel for decades. It is powerful yet easy to use, however, one of the biggest issues with Excel is that it is hard to integrate an Excel file with other systems and services, especially with a database. If you upload an Excel file as an attachment to a system and have to download it and open it up in Excel whenever you need to edit the file, you are just using Excel in a standalone manner. This is not an integrated solution.
In this article, I will show you how you can make your Excel file work seamlessly in a database-driven web application.
Excelize is a library written in pure Go that provides a set of functions that allow you to read and write from XLSX files generated by Microsoft Excel™ 2007 and later. It supports saving a file without losing original charts of XLSX. This library is only available in version 1.10 or later of Go. The full API docs can be accessed using Go's built-in documentation tool or online atgodoc.organddocs referenc. GitHub: https://github.com/360EntSecGroup-Skylar/exceliz. Document: https://xuri.me/excelize/.
Installation
Go
xxxxxxxxxx
1
1
gogetgithub.com/360EntSecGroup-Skylar/excelize
Create an XLSX File
Here is a minimal example that will create an XLSX file:
The following constitutes the minimum implementation required to read an XLSX file:
Go
xxxxxxxxxx
1
26
1
packagemain
2
3
import"github.com/360EntSecGroup-Skylar/excelize"
4
5
funcmain() {
6
f, err :=excelize.OpenFile("Book1.xlsx")
7
iferr!=nil {
8
println(err.Error())
9
return
10
}
11
// Get value from cell by given worksheet name and axis.
12
cell, err :=f.GetCellValue("Sheet1", "B2")
13
iferr!=nil {
14
println(err.Error())
15
return
16
}
17
println(cell)
18
// Get all the rows in the Sheet1.
19
rows, err :=f.GetRows("Sheet1")
20
for_, row :=rangerows {
21
for_, colCell :=rangerow {
22
print(colCell, "\t")
23
}
24
println()
25
}
26
}
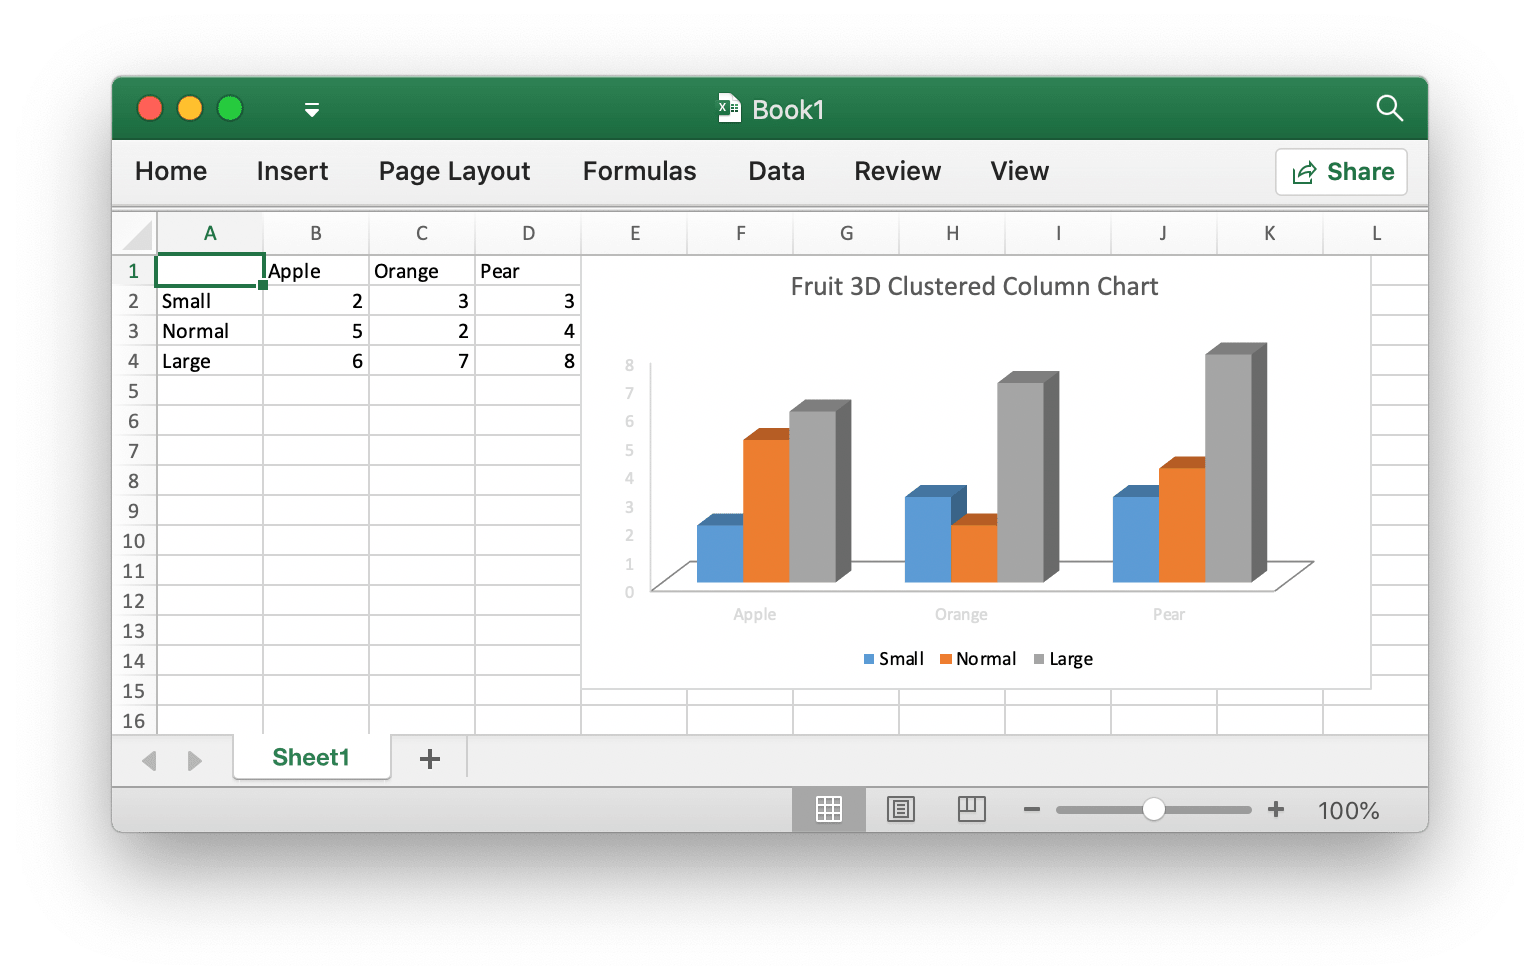
Add a Chart to an XLSX File
With Excelize, chart generation and management can be implemented with a few lines of code. You can build charts based off data in your worksheet or generate charts without any data in your worksheet at all.
Measure, predict, prevent: fighting brain injury with the power of big data
Big Data is continuing to transform human life, and its impact on healthcare has been nothing short of revolutionary. Although big data in healthcare is experiencing a massive boom, some areas of medicine are benefiting from it the most. Healthcare providers are exploring the potential of Big Data playing a bigger role in the treatment of Traumatic Brain Injuries (TBI).
It’s estimated that 2.8 million people in the United States sustain TBI annually. Out of this total, 50,000 die as a result, and 282,000 are hospitalized; hospitals are seeking new ways to fight this problem.
Hi there. Today, I’d like to share a bit of code I made to turn a repetitive Excel task into an automated web application. We have so many time-consuming processes that are easy to automate and make easier.
Our administrative staff deals with contractors and suppliers. We have the usual system in which every single company working with us needs to provide its administrative information through the vendor registration form. Being added to the approved vendor list is a necessary step before we can order services or supplies from them.
The era of data analysis has already arrived. From the state, government, and enterprises to individuals, big data and data analysis have become trends that everyone is familiar with. But you may not have the professional knowledge of data analysis and programming, or you have learned a lot about the theory of data analysis, but you still can't practice it. Here, I will compare the four tools that are most popular with data analysts, Excel, R, Python, and BI, as the basis for getting started with data analysis.
1. Excel
1.1 Usage Scenarios
Data processing work under general office requirements.
Data management and storage of small and medium-sized companies.
Simple statistical analysis for students or teachers (such as analysis of variance, regression analysis, etc.).
Combine Word and PowerPoint to create data analysis reports.
Assistant tool of data analysts.
Production of charts for some business magazines and newspapers (data visualization).
1.2 Advantages
It's easy to get started with Excel.
The learning resources are very rich.
You can do a lot of things with Excel: modeling, visualization, reports, dynamic charts, etc.
It can help you understand the meaning of many operations before further learning other tools (such as Python and R).
1.3 Disadvantages
To fully master Excel, you need to learn VBA, so the difficulty is still very high.
When the amount of data is large, there will be a situation of stuttering.
The Excel data file itself can hold only 1.08 million rows without the aid of other tools, and it's not suitable for processing large-scale data sets.
The built-in statistical analysis is too simple and has little practical value.
Unlike Python, R, and other open source software, there is a charge for the genuine Excel.
2. R
2.1 Usage Scenarios
The functions of R cover almost any area where data is needed. As far as our general data analysis or academic data analysis work is concerned, the things that R can do mainly include the following aspects.
When legacy Business Intelligence (BI) solutions emerged, the goal was to simplify data access and analysis across an entire company. Sadly, the benefits of these solutions were never realized. Decades later, companies still aren’t seeing the adoption they expected—meanwhile, billions have been spent on BI. Something is clearly missing.
According to IDC, worldwide revenues for big data and BI solutions will reach $260 billion in 2022. Yet, even with all this projected growth, Tableau’s & PowerBI's success, and Looker’s $103 million-dollar funding round, 88% of IT decision makers will choose Excel as the primary tool to explore company data in 2019. So what gives?
Even today, when project management and spreadsheet programs are getting better by nearly every conceivable standard, Microsoft Excel is still a popular choice for many.
Whether it’s owing to the fact that it is a simple spreadsheet platform which allows maximum customization, or that it lets you quickly process data, Excel is an essential tool in many workplaces.