SVG and canvas are both technologies that can draw stuff in web browsers, so they are worth comparing and understanding when one is more suitable than the other. Even a light understanding of them makes the choice of choosing one over the other pretty clear.
A little flat-color icon? That's clearly SVG territory.
An interactive console-like game? That's clearly canvas territory.
I know we didn't cover why yet, but I hope that will become clear as we dig into it.
SVG is vector and declarative
If you know you need vector art, SVG is the choice. Vector art is visually crisp and tends to be a smaller file size than raster graphics like JPG.
If you care a lot about the flexibility and responsiveness of the graphic, SVG is the way.
Canvas is a JavaScript drawing API
You put a <canvas> element in HTML, then do the drawing in JavaScript. In other words, you issue commands to tell it how to draw (which is more imperative than declarative).
<canvas id="myCanvas" width="578" height="200"></canvas>
<script>
  var canvas = document.getElementById('myCanvas');
  var context = canvas.getContext('2d');
  var centerX = canvas.width / 2;
  var centerY = canvas.height / 2;
  var radius = 70;

  context.beginPath();
  context.arc(centerX, centerY, radius, 0, 2 * Math.PI, false);
  context.fillStyle = 'green';
  context.fill();
</script>
SVG is in the DOM
If you're familiar with DOM events like click and mouseDown and whatnot, those are available in SVG as well. A <circle> isn't terribly different than a <div> in that respect.
You can do that in SVG too, but since SVG and its guts can be right in the DOM, we generally think of SVG as being what you use if you're trying to build an accessible experience. Explained another way, you can build an SVG that assistive technology can access and find links and sub-elements with their own auditory explanations and such.
As you'll see in Sarah Dranser's comparison below, canvas is a way of saying dance, pixels, dance!. That's a fun way of explaining the concept that drives it home better than any dry technical sentiment could do.
Highly interactive work with lots and lots of complex detail and gradients is the territory of canvas. You'll see a lot more games built with canvas than SVG for this reason, although there are always exceptions (note the simple vector-y-ness of this game).
CSS can play with SVG
We saw above that SVG can be in the DOM and that JavaScript can get in there and do stuff. The story is similar with CSS.
Note how I've put the <script> and <style> blocks within the <svg> for these examples, which is valid. But assuming you've put the SVG literally in the HTML, you could move those out, or have other external CSS and JavaScript do the same thing.
We have a massive guide of SVG Properties and CSS. But what is great to know is that the stuff that CSS is great at is still possible in SVG, like :hover states and animation!
Many folks consider scenarios with a lot of objects (1,000+, as Shirley says) is the territory of canvas.
SVG is the default choice; canvas is the backup
A strong opinion, but it feels right to me:
One extremely basic way to answer it is "use canvas when you cannot use svg" (where "cannot" might mean animating thousands of objects, manipulating each pixel individually, etc.). To put it another way, SVG should be your default choice, canvas your backup plan.
So, if we revisit those first two bullet points...
A little flat-color icon? SVG goes in the DOM, so something like an icon inside a button makes a lot of sense for SVG — not to mention it can be controlled with CSS and have regular JavaScript event handlers and stuff
An interactive console-like game? That will have lots and lots of moving elements, complex animation and interaction, performance considerations. Those are things that canvas excels at.
And yet there is a bunch of middle ground here. As a day-to-day web designer/developer kinda guy, I find SVG far more useful on a practical level. I'm not sure I've done any production work in canvas ever. Part of that is because I don't know canvas nearly as well. I wrote a book on SVG, so I've done far more research on that side, but I know enough that SVG is doing the right stuff for my needs.
Flash’s grandson, WebGL has become more and more popular over the last few years with libraries like Three.js, PIXI.js or the recent OGL.js. Those are very useful for easily creating a blank board where the only boundaries are your imagination. We see more and more, often subtle integration of WebGL in an interface for hover, scroll or reveal effects. Examples are the gallery of articles on Hello Monday or the effects seen on cobosrl.co.
In this tutorial, we’ll use Three.js to create a special gooey texture that we’ll use to reveal another image when hovering one. Head over to the demo to see the effect in action. For the demo itself, I’ve created a more practical example that shows a vertical scrollable layout with images, where each one has a variation of the effect. You can click on an image and it will expand to a larger version while some other content shows up (just a mock-up). We’ll go over the most interesting parts of the effect, so that you get an understanding of how it works and how to create your own.
Attention: This tutorial covers many parts; if you prefer, you can skip the HTML/CSS/JavaScript part and go directly go to the shaders section.
Now that we are clear, let’s do this!
Create the scene in the DOM
Before we start making some magic, we are first going to mark up the images in the HTML. It will be easier to handle resizing our scene after we’ve set up the initial position and dimension in HTML/CSS rather than positioning everything in JavaScript. Moreover, the styling part should be only made with CSS, not JavaScript. For example, if our image has a ratio of 16:9 on desktop but a 4:3 ratio on mobile, we just want to handle this using CSS. JavaScript will only get the new values and do its stuff.
As you can see above, we have create a single image that is centered in the middle of our screen. Did you notice the data-src and data-hover attributes on the image? These will be our reference images and we’ll load both of these later in our script with lazy loading.
Don’t forget the canvas. We’ll stack it below our main section to draw the images in the exact same place as we have placed them before.
Create the scene in JavaScript
Let’s get started with the less-easy-but-ok part! First, we’ll create the scene, the lights, and the renderer.
// Scene.js

import * as THREE from 'three'

export default class Scene {
	constructor() {
		this.container = document.getElementById('stage')

		this.scene = new THREE.Scene()
		this.renderer = new THREE.WebGLRenderer({
			canvas: this.container,
			alpha: true,
	  })

		this.renderer.setSize(window.innerWidth, window.innerHeight)
		this.renderer.setPixelRatio(window.devicePixelRatio)

		this.initLights()
	}

	initLights() {
		const ambientlight = new THREE.AmbientLight(0xffffff, 2)
		this.scene.add(ambientlight)
	}
}
This is a very basic scene. But we need one more essential thing in our scene: the camera. We have a choice between two types of cameras: orthographic or perspective. If we keep our image flat, we can use the first one. But for our rotation effect, we want some perspective as we move the mouse around.
In Three.js (and other libraries for WebGL) with a perspective camera, 10 unit values on our screen are not 10px. So the trick here is to use some math to transform 1 unit to 1 pixel and change the perspective to increase or decrease the distortion effect.
We’ll set the perspective to 800 to have a not-so-strong distortion as we rotate the plane. The more we increase the perspective, the less we’ll perceive the distortion, and vice versa.
The last thing we need to do is to render our scene in each frame.
If your screen is not black, you are on the right way!
Build the plane with the correct sizes
As we mentioned above, we have to retrieve some additional information from the image in the DOM like its dimension and position on the page.
// Scene.js

import Figure from './Figure'

constructor() {
	// ...
	this.figure = new Figure(this.scene)
}
// Figure.js

export default class Figure {
	constructor(scene) {
		this.$image = document.querySelector('.tile__image')
		this.scene = scene

		this.loader = new THREE.TextureLoader()

		this.image = this.loader.load(this.$image.dataset.src)
		this.hoverImage = this.loader.load(this.$image.dataset.hover)
		this.sizes = new THREE.Vector2(0, 0)
		this.offset = new THREE.Vector2(0, 0)

		this.getSizes()

		this.createMesh()
	}
}
First, we create another class where we pass the scene as a property. We set two new vectors, dimension and offset, in which we’ll store the dimension and position of our DOM image.
Furthermore, we’ll use a TextureLoader to “load” our images and convert them into a texture. We need to do that as we want to use these pictures in our shaders.
We need to create a method in our class to handle the loading of our images and wait for a callback. We could achieve that with an async function but for this tutorial, let’s keep it simple. Just keep in mind that you’ll probably need to refactor this a bit for your own purposes.
We get our image information in the getBoundingClientRect object. After that, we’ll pass these to our two variables. The offset is here to calculate the distance between the center of the screen and the object on the page.
After that, we’ll set our values on the plane we’re building. As you can notice, we have created a plane of 1 on 1px with 1 row and 1 column. As we don’t want to distort the plane, we don’t need a lot of faces or vertices. So let’s keep it simple.
But why scale it while we can set the size directly? Glad you asked.
Because of the resizing part. If we want to change the size of our mesh afterwards, there is no other proper way than this one. While it’s easier to change the scale of the mesh, it’s not for the dimension.
For the moment, we set a MeshBasicMaterial, just to see if everything is fine.
Get mouse coordinates
Now that we have built our scene with our mesh, we want to get our mouse coordinates and, to keep things easy, we’ll normalize them. Why normalize? Because of the coordinate system in shaders.
As you can see in the figure above, we have normalized the values for both of our shaders. So to keep things simple, we’ll prepare our mouse coordinate to match the vertex shader coordinate.
If you’re lost at this point, I recommend you to read the Book of Shaders and the respective part of Three.js Fundamentals. Both have good advice and a lot of examples to help understand what’s going on.
For the tween parts, I’m going to use TweenMax from GreenSock. This is the best library ever. EVER. And it’s perfect for our purpose. We don’t need to handle the transition between two states, TweenMax will do it for us. Each time we move our mouse, TweenMax will update the position and the rotation smoothly.
One last thing before we continue: we’ll update our material from MeshBasicMaterial to ShaderMaterial and pass some values (uniforms) and shaders.
We passed our two textures, the mouse position, the size of our screen and a variable called u_time which we will increment each frame.
But keep in mind that it’s not the best way to do that. For example, we only need to increment when we are hovering the figure, not every frame. I’m not going into details, but performance-wise, it’s better to just update our shader only when we need it.
The logic behind the trick & how to use noise
Still here? Nice! Time for some magic tricks.
I will not explain what noise is and where it comes from. If you’re interested, be sure to read this page from The Book of Shaders. It’s well explained.
Long story short, Noise is a function that gives us a value between -1 and 1 based on values we pass through. It will output a random pattern but more organic.
Thanks to noise, we can generate a lot of different shapes, like maps, random patterns, etc.
Let’s start with a 2D noise result. Just by passing the coordinate of our texture, we’ll have something like a cloud texture.
But there are several kinds of noise functions. Let’s use a 3D noise by giving one more parameter like … the time? The noise pattern will evolve and change over time. By changing the frequency and the amplitude, we can give some movement and increase the contrast.
It will be our first base.
Second, we’ll create a circle. It’s quite easy to build a simple shape like a circle in the fragment shader. We just take the function from The Book of Shaders: Shapes to create a blurred circle, increase the contrast and voilà!
Last, we add these two together, play with some variables, cut a “slice” of this and tadaaa:
We finally mix our textures together based on this result and here we are, easy peasy lemon squeezy!
Let’s dive into the code.
Shaders
We won’t really need the vertex shader here so this is our code:
position (vec3): the coordinates of each vertex of our mesh
uv (vec2): the coordinates of our texture
normals (vec3): normal of each vertex our mesh have.
Here we’re just passing the UV coordinates from the vertex shader to fragment shader.
Create the circle
Let’s use the function from The Book of Shaders to build our circle and add a variable to handle the blurriness of our edges.
Moreover, we’ll add the mouse position to the origin of our circle. This way, the circle will be moving as long as we move our mouse over our image.
// fragmentShader.glsl
uniform vec2 u_mouse;
uniform vec2 u_res;

float circle(in vec2 _st, in float _radius, in float blurriness){
	vec2 dist = _st;
	return 1.-smoothstep(_radius-(_radius*blurriness), _radius+(_radius*blurriness), dot(dist,dist)*4.0);
}

void main() {
	vec2 st = gl_FragCoord.xy / u_res.xy - vec2(1.);
	// tip: use the following formula to keep the good ratio of your coordinates
	st.y *= u_res.y / u_res.x;

	vec2 mouse = u_mouse;
	// tip2: do the same for your mouse
	mouse.y *= u_res.y / u_res.x;
	mouse *= -1.;

	vec2 circlePos = st + mouse;
	float c = circle(circlePos, .03, 2.);

	gl_FragColor = vec4(vec3(c), 1.);
}
Make some noooooise
As we saw above, the noise function has several parameters and gives us a smooth cloudy pattern. How could we have that? Glad you asked.
For this part, I’m using glslify and glsl-noise, and two npm packages to include other functions. It keeps our shader a little bit more readable and avoids having a lot of displayed functions that we will not use after all.
As you can see, I changed the amplitude and the frequency to have the render I desire.
Alright, let’s add them together!
Merging both textures
By just adding these together, we’ll already see an interesting shape changing through time.
To explain what’s happening, let’s imagine our noise is like a sea floating between -1 and 1. But our screen can’t display negative color or pixels more than 1 (pure white) so we are just seeing the values between 0 and 1.
And our circle is like a flan.
By adding these two shapes together it will give this very approximative result:
Our very white pixels are only pixels outside the visible spectrum.
If we scale down our noise and subtract a small number, it will be completely moving down your waves until it disappears above the surface of the ocean of visible colors.
Thanks to this function, we’ll cut a slice of our pattern between 0.4 et 0.5, for example. The shorter the space is between these values, the sharper the edges are.
Finally, we can mix our two textures to use them as a mask.
Check out the full source here or take a look at the live demo.
Mic drop
Congratulations to those who came this far. I haven’t planned to explain this much. This isn’t perfect and I might have missed some details but I hope you’ve enjoyed this tutorial anyway. Don’t hesitate to play with variables, try other noise functions and try to implement other effects using the mouse direction or play with the scroll!
If you have any questions, let me know in the comments section! I also encourage you to download the demo, it’s a little bit more complex and shows the effects in action with hover and click effects ¯\_(?)_/¯
In this tutorial we’re going to build a water-like effect with a bit of basic math, a canvas, and postprocessing. No fluid simulation, GPGPU, or any of that complicated stuff. We’re going to draw pretty circles in a canvas, and distort the scene with the result.
We recommend that you get familiar with the basics of Three.js because we’ll omit some of the setup. But don’t worry, most of the tutorial will deal with good old JavaScript and the canvas API. Feel free to chime in if you don’t feel too confident on the Three.js parts.
The effect is divided into two main parts:
Capturing and drawing the ripples to a canvas
Displacing the rendered scene with postprocessing
Let’s start with updating and drawing the ripples since that’s what constitutes the core of the effect.
Making the ripples
The first idea that comes to mind is to use the current mouse position as a uniform and then simply displace the scene and call it a day. But that would mean only having one ripple that always remains at the mouse’s position. We want something more interesting, so we want many independent ripples moving at different positions. For that we’ll need to keep track of each one of them.
We’re going to create a WaterTexture class to manage everything related to the ripples:
Capture every mouse movement as a new ripple in an array.
Draw the ripples to a canvas
Erase the ripples when their lifespan is over
Move the ripples using their initial momentum
For now, let’s begin coding by creating our main App class.
import { WaterTexture } from './WaterTexture';
class App{
    constructor(){
        this.waterTexture = new WaterTexture({ debug: true });

        this.tick = this.tick.bind(this);
    	this.init();
    }
    init(){
        this.tick();
    }
    tick(){
        this.waterTexture.update();
        requestAnimationFrame(this.tick);
    }
}
const myApp = new App();
Let’s create our ripple manager WaterTexture with a teeny-tiny 64px canvas.
Note that for development purposes there is a debug option to mount the canvas to the DOM and give it a bigger size. In the end result we won’t be using this option.
Now we can go ahead and start adding some of the logic to make our ripples work:
On constructor() add
this.points array to keep all our ripples
this.radius for the max-radius of a ripple
this.maxAge for the max-age of a ripple
On Update(),
clear the canvas
sing happy birthday to each ripple, and remove those older than this.maxAge
draw each ripple
Create AddPoint(), which is going to take a normalized position and add a new point to the array.
Note that AddPoint() receives normalized values, from 0 to 1. If the canvas happens to resize, we can use the normalized points to draw using the correct size.
Let’s create drawPoint(point) to start drawing the ripples: Convert the normalized point coordinates into canvas coordinates. Then, draw a happy little circle:
class WaterTexture(){
    ...
    drawPoint(point) {
        // Convert normalized position into canvas coordinates
        let pos = {
            x: point.x * this.width,
            y: point.y * this.height
        }
        const radius = this.radius;


        this.ctx.beginPath();
        this.ctx.arc(pos.x, pos.y, radius, 0, Math.PI * 2);
        this.ctx.fill();
    }
}
For our ripples to have a strong push at the center and a weak force at the edges, we’ll make our circle a Radial Gradient, which looses transparency as it moves to the edges.
Radial Gradients create a dithering-like effect when a lot of them overlap. It looks stylish but not as smooth as what we want it to look like.
To make our ripples smooth, we’ll use the circle’s shadow instead of using the circle itself. Shadows give us the gradient-like result without the dithering-like effect. The difference is in the way shadows are painted to the canvas.
Since we only want to see the shadow and not the flat-colored circle, we’ll give the shadow a high offset. And we’ll move the circle in the opposite direction.
As the ripple gets older, we’ll reduce it’s opacity until it disappears:
export class WaterTexture(){
    ...
    drawPoint(point) {
        ...
        const ctx = this.ctx;
        // Lower the opacity as it gets older
        let intensity = 1.;
        intensity = 1. - point.age / this.maxAge;

        let color = "255,255,255";

        let offset = this.width * 5.;
        // 1. Give the shadow a high offset.
        ctx.shadowOffsetX = offset;
        ctx.shadowOffsetY = offset;
        ctx.shadowBlur = radius * 1;
        ctx.shadowColor = `rgba(${color},${0.2 * intensity})`;


        this.ctx.beginPath();
        this.ctx.fillStyle = "rgba(255,0,0,1)";
        // 2. Move the circle to the other direction of the offset
        this.ctx.arc(pos.x - offset, pos.y - offset, radius, 0, Math.PI * 2);
        this.ctx.fill();
    }
}
To introduce interactivity, we’ll add the mousemove event listener to app class and send the normalized mouse position to WaterTexture.
import { WaterTexture } from './WaterTexture';
class App {
	...
	init(){
        window.addEventListener('mousemove', this.onMouseMove.bind(this));
        this.tick();
	}
	onMouseMove(ev){
        const point = {
			x: ev.clientX/ window.innerWidth,
			y: ev.clientY/ window.innerHeight,
        }
        this.waterTexture.addPoint(point);
	}
}
Great, now we’ve created a disappearing trail of ripples. Now, let’s give them some momentum!
Momentum
To give momentum to a ripple, we need its direction and force. Whenever we create a new ripple, we’ll compare its position with the last ripple. Then we’ll calculate its unit vector and force.
On every update, we’ll update the ripples’ positions with their unit vector and position. And as they get older we’ll move them slower and slower until they retire or go live on a farm. Whatever happens first.
Note that instead of using the last ripple in the array, we use a dedicated this.last. This way, our ripples always have a point of reference to calculate their force and unit vector.
Let’s fine-tune the intensity with some easings. Instead of just decreasing until it’s removed, we’ll make it increase at the start and then decrease:
Now we're finished with creating and updating the ripples. It's looking amazing.
But how do we use what we have painted to the canvas to distort our final scene?
Canvas as a texture
Let's use the canvas as a texture, hence the name WaterTexture. We are going to draw our ripples on the canvas, and use it as a texture in a postprocessing shader.
First, let's make a texture using our canvas and refresh/update that texture at the end of every update:
import * as THREE from 'three'
class WaterTexture(){
	initTexture(){
		...
		this.texture = new THREE.Texture(this.canvas);
	}
	update(){
        ...
		this.texture.needsUpdate = true;
	}
}
By creating a texture of our canvas, we can sample our canvas like we would with any other texture. But how is this useful to us? Our ripples are just white spots on the canvas.
In the distortion shader, we're going to need the direction and intensity of the distortion for each pixel. If you recall, we already have the direction and force of each ripple. But how do we communicate that to the shader?
Encoding data in the color channels
Instead of thinking of the canvas as a place where we draw happy little clouds, we are going to think about the canvas' color channels as places to store our data and read them later on our vertex shader.
In the Red and Green channels, we'll store the unit vector of the ripple. In the Blue channel, we'll store the intensity of the ripple.
Since RGB channels range from 0 to 255, we need to send our data that range to normalize it. So, we'll transform the unit vector range (-1 to 1) and the intensity range (0 to 1) into 0 to 255.
class WaterEffect {
    drawPoint(point){
		...

		// Insert data to color channels
        // RG = Unit vector
        let red = ((point.vx + 1) / 2) * 255;
        let green = ((point.vy + 1) / 2) * 255;
        // B = Unit vector
        let blue = intensity * 255;
        let color = `${red}, ${green}, ${blue}`;


        let offset = this.size * 5;
        ctx.shadowOffsetX = offset;
        ctx.shadowOffsetY = offset;
        ctx.shadowBlur = radius * 1;
        ctx.shadowColor = `rgba(${color},${0.2 * intensity})`;

        this.ctx.beginPath();
        this.ctx.fillStyle = "rgba(255,0,0,1)";
        this.ctx.arc(pos.x - offset, pos.y - offset, radius, 0, Math.PI * 2);
        this.ctx.fill();
    }
}
Note: Remember how we painted the canvas black? When our shader reads that pixel, it's going to apply a distortion of 0, only distorting where our ripples are painting.
Look at the pretty color our beautiful data gives the ripples now!
With that, we're finished with the ripples. Next, we'll create our scene and apply the distortion to the result.
Creating a basic Three.js scene
For this effect, it doesn't matter what we render. So, we'll only have a single plane to showcase the effect. But feel free to create an awesome-looking scene and share it with us in the comments!
Since we're done with WaterTexture, don't forget to turn the debug option to false.
import * as THREE from "three";
import { WaterTexture } from './WaterTexture';

class App {
    constructor(){
        this.waterTexture = new WaterTexture({ debug: false });

        this.renderer = new THREE.WebGLRenderer({
          antialias: false
        });
        this.renderer.setSize(window.innerWidth, window.innerHeight);
        this.renderer.setPixelRatio(window.devicePixelRatio);
        document.body.append(this.renderer.domElement);

        this.camera = new THREE.PerspectiveCamera(
          45,
          window.innerWidth / window.innerHeight,
          0.1,
          10000
        );
        this.camera.position.z = 50;

        this.touchTexture = new TouchTexture();

        this.tick = this.tick.bind(this);
        this.onMouseMove = this.onMouseMove.bind(this);

        this.init();

    }
    addPlane(){
        let geometry = new THREE.PlaneBufferGeometry(5,5,1,1);
        let material = new THREE.MeshNormalMaterial();
        let mesh = new THREE.Mesh(geometry, material);

        window.addEventListener("mousemove", this.onMouseMove);
        this.scene.add(mesh);
    }
    init(){
    	this.addPlane();
    	this.tick();
    }
    render(){
        this.renderer.render(this.scene, this.camera);
    }
    tick(){
        this.render();
        this.waterTexture.update();
        requrestAnimationFrame(this.tick);
    }
}
Applying the distortion to the rendered scene
We are going to use postprocessing to apply the water-like effect to our render.
Postprocessing allows you to add effects or filters after (post) your scene is rendered (processing). Like any kind of image effect or filter you might see on snapchat or Instagram, there is a lot of cool stuff you can do with postprocessing.
For our case, we'll render our scene normally with a RenderPass, and apply the effect on top of it with a custom EffectPass.
Let's render our scene with postprocessing's EffectComposer instead of the Three.js renderer.
Note that EffectComposer works by going through its passes on each render. It doesn't render anything unless it has a pass for it. We need to add the render of our scene using a RenderPass:
import { EffectComposer, RenderPass } from 'postprocessing'
class App{
    constructor(){
        ...
		this.composer = new EffectComposer(this.renderer);
         this.clock = new THREE.Clock();
        ...
    }
    initComposer(){
        const renderPass = new RenderPass(this.scene, this.camera);

        this.composer.addPass(renderPass);
    }
    init(){
    	this.initComposer();
    	...
    }
    render(){
        this.composer.render(this.clock.getDelta());
    }
}
Things should look about the same. But now we start adding custom postprocessing effects.
We are going to create the WaterEffect class that extends postprocessing's Effect. It is going to receive the canvas texture in the constructor and make it a uniform in its fragment shader.
In the fragment shader, we'll distort the UVs using postprocessing's function mainUv using our canvas texture. Postprocessing is then going to take these UVs and sample our regular scene distorted.
Although we'll only use postprocessing's mainUv function, there are a lot of interesting functions you can use. I recommend you check out the wiki for more information!
Since we already have the unit vector and intensity, we only need to multiply them together. But since the texture values are normalized we need to convert our unit vector from a range of 1 to 0, into a range of -1 to 0:
import * as THREE from "three";
import { Effect } from "postprocessing";

export class WaterEffect extends Effect {
  constructor(texture) {
    super("WaterEffect", fragment, {
      uniforms: new Map([["uTexture", new THREE.Uniform(texture)]])
    });
  }
}
export default WaterEffect;

const fragment = `
uniform sampler2D uTexture;
#define PI 3.14159265359

void mainUv(inout vec2 uv) {
        vec4 tex = texture2D(uTexture, uv);
		// Convert normalized values into regular unit vector
        float vx = -(tex.r *2. - 1.);
        float vy = -(tex.g *2. - 1.);
		// Normalized intensity works just fine for intensity
        float intensity = tex.b;
        float maxAmplitude = 0.2;
        uv.x += vx * intensity * maxAmplitude;
        uv.y += vy * intensity * maxAmplitude;
    }
`;
We'll then instantiate WaterEffect with our canvas texture and add it as an EffectPass after our RenderPass. Then we'll make sure our composer only renders the last effect to the screen:
import { WaterEffect } from './WaterEffect'
import { EffectPass } from 'postprocessing'
class App{
    ...
	initComposer() {
        const renderPass = new RenderPass(this.scene, this.camera);
        this.waterEffect = new WaterEffect(  this.touchTexture.texture);

        const waterPass = new EffectPass(this.camera, this.waterEffect);

        renderPass.renderToScreen = false;
        waterPass.renderToScreen = true;
        this.composer.addPass(renderPass);
        this.composer.addPass(waterPass);
	}
}
And here we have the final result!
An awesome and fun effect to play with!
Conclusion
Through this article, we've created ripples, encoded their data into the color channels and used it in a postprocessing effect to distort our render.
That's a lot of complicated-sounding words! Great work, pat yourself on the back or reach out on Twitter and I'll do it for you
But there's still a lot more to explore:
Drawing the ripples with a hollow circle
Giving the ripples an actual radial-gradient
Expanding the ripples as they get older
Or using the canvas as a texture technique to create interactive particles as in Bruno's article.
We hope you enjoyed this tutorial and had a fun time making ripples. If you have any questions, don't hesitate to comment below or on Twitter!
It’s the first thing your eyes look for when you’re switching tabs.
That’s one way of explaining what a favicon is. The tab area is a much more precious screen real-estate than what most assume. If done right, besides being a label with icon, it can be the perfect billboard to represent what’s in or what’s happening on a web page.
The CSS-Tricks Favicon
Favicons are actually at their most useful when you’re not active on a tab. Here’s an example:
Imagine you’re backing up photos from your recent summer vacation to a cloud service. While they are uploading, you’ve opened a new tab to gather details about the places you went on vacation to later annotate those photos. One thing led to the other, and now you’re watching Casey Neistat on the seventh tab. But you can’t continue your YouTube marathon without the anxious intervals of checking back on the cloud service page to see if the photos have been uploaded.
It’s this type of situation where we can get creative! What if we could dynamically change the pixels in that favicon and display the upload progress? That’s exactly what we’ll do in this article.
In supported browsers, we can display a loading/progress animation as a favicon with the help of JavaScript, HTML <canvas> and some centuries-old geometry.
Jumping straight in, we’ll start with the easiest part: adding the icon and canvas elements to the HTML.
In practical use, you would want to hide the <canvas> on the page, and one way of doing that is with the HTML hidden attribute.
<canvas hidden width=32 height=32></canvas>
I’m going to leave the <canvas> visible on the page for you to see both the favicon and canvas images animate together.
Both the favicon and the canvas are given a standard favicon size: 32 square pixels.
For demo purposes, in order to trigger the loading animation, I’m adding a button to the page which will start the animation when clicked. This also goes in the HTML:
<button>Load</button>
Now let’s set up the JavaScript. First, a check for canvas support:
onload = ()=> {
  canvas = document.querySelector('canvas'),
  context = canvas.getContext('2d');
  if (!!context) {
      /* if canvas is supported */
  }
};
Next, adding the button click event handler that will prompt the animation in the canvas.
button = document.querySelector('button');
button.addEventListener('click', function() {
    /* A variable to track the drawing intervals */
    n = 0,
    /* Interval speed for the animation */
    loadingInterval = setInterval(drawLoader, 60);
});
drawLoader will be the function doing the drawing at intervals of 60 milliseconds each, but before we code it, I want to define the style of the lines of the square to be drawn. Let’s do a gradient.
/* Style of the lines of the square that'll be drawn */
let gradient = context.createLinearGradient(0, 0, 32, 32);
gradient.addColorStop(0, '#c7f0fe');
gradient.addColorStop(1, '#56d3c9');
context.strokeStyle = gradient;
context.lineWidth = 8;
In drawLoader, we’ll draw the lines percent-wise: during the first 25 intervals, the top line will be incrementally drawn; in second quarter, the right line will be drawn; and so forth.
The animation effect is achieved by erasing the <canvas> in each interval before redrawing the line(s) from previous interval a little longer.
During each interval, once the drawing is done in the canvas, it’s quickly translated to a PNG image to be assigned as the favicon.
function drawLoader() {
  with(context) {
    clearRect(0, 0, 32, 32);
    beginPath();
    /* Up to 25% */
    if (n<=25){
      /*
        (0,0)-----(32,0)
      */
      // code to draw the top line, incrementally
    }
    /* Between 25 to 50 percent */
    else if(n>25 && n<=50){
      /*
        (0,0)-----(32,0)
                  |
                  |
                  (32,32)
      */
      // code to draw the top and right lines.
    }
    /* Between 50 to 75 percent */
    else if(n>50 && n<= 75){
      /*
        (0,0)-----(32,0)
                  |
                  |
        (0,32)----(32,32)
      */
      // code to draw the top, right and bottom lines.
    }
      /* Between 75 to 100 percent */
    else if(n>75 && n<=100){
      /*
        (0,0)-----(32,0)
            |      |
            |      |
        (0,32)----(32,32)
      */
      // code to draw all four lines of the square.
    }
    stroke();
  }
  // Convert the Canvas drawing to PNG and assign it to the favicon
  favicon.href = canvas.toDataURL('image/png');
  /* When finished drawing */
  if (n === 100) {
    clearInterval(loadingInterval);
    return;
  }
  // Increment the variable used to keep track of the drawing intervals
  n++;
}
Now to the math and the code for drawing the lines.
Here’s how we incrementally draw the top line at each interval during the first 25 intervals:
n = current interval,
x = x-coordinate of the line’s end point at a given interval.
(y-coordinate of the end point is 0 and start point of the line is 0,0)
At the completion of all 25 intervals, the value of x is 32 (the size of the favicon and canvas.)
So...
x/n = 32/25
x = (32/25) * n
The code to apply this math and draw the line is:
moveTo(0, 0); lineTo((32/25)*n, 0);
For the next 25 intervals (right line), we target the y coordinate similarly.
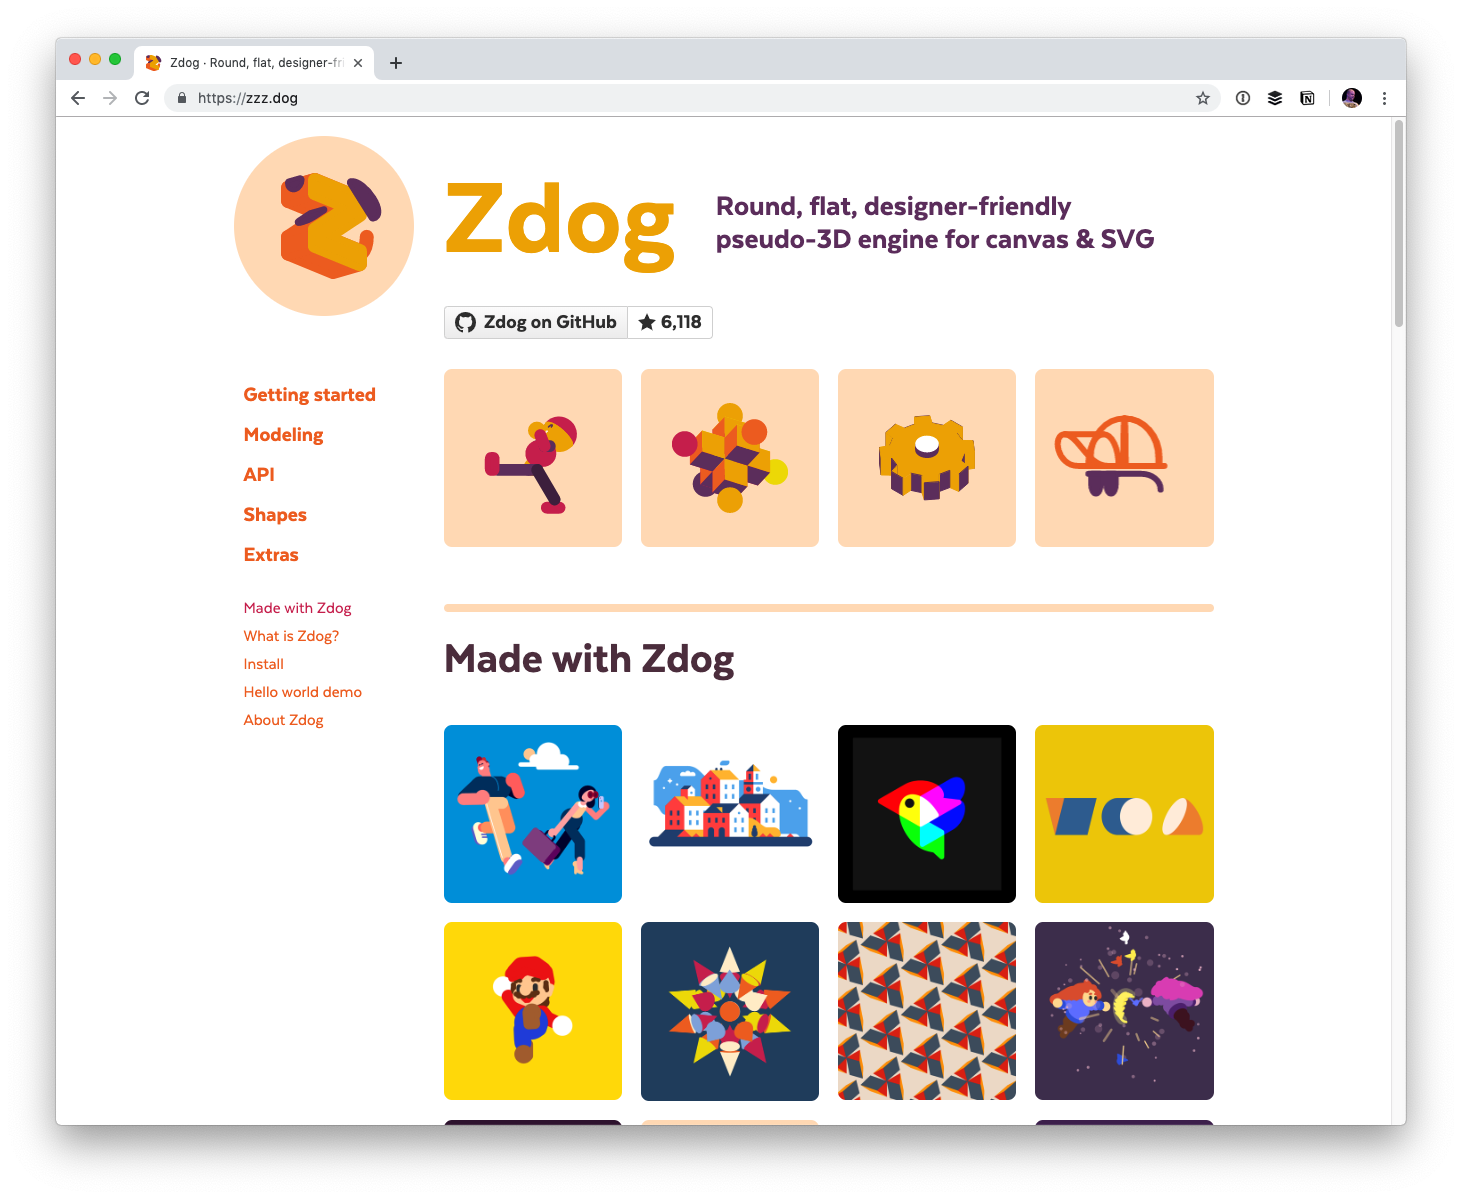
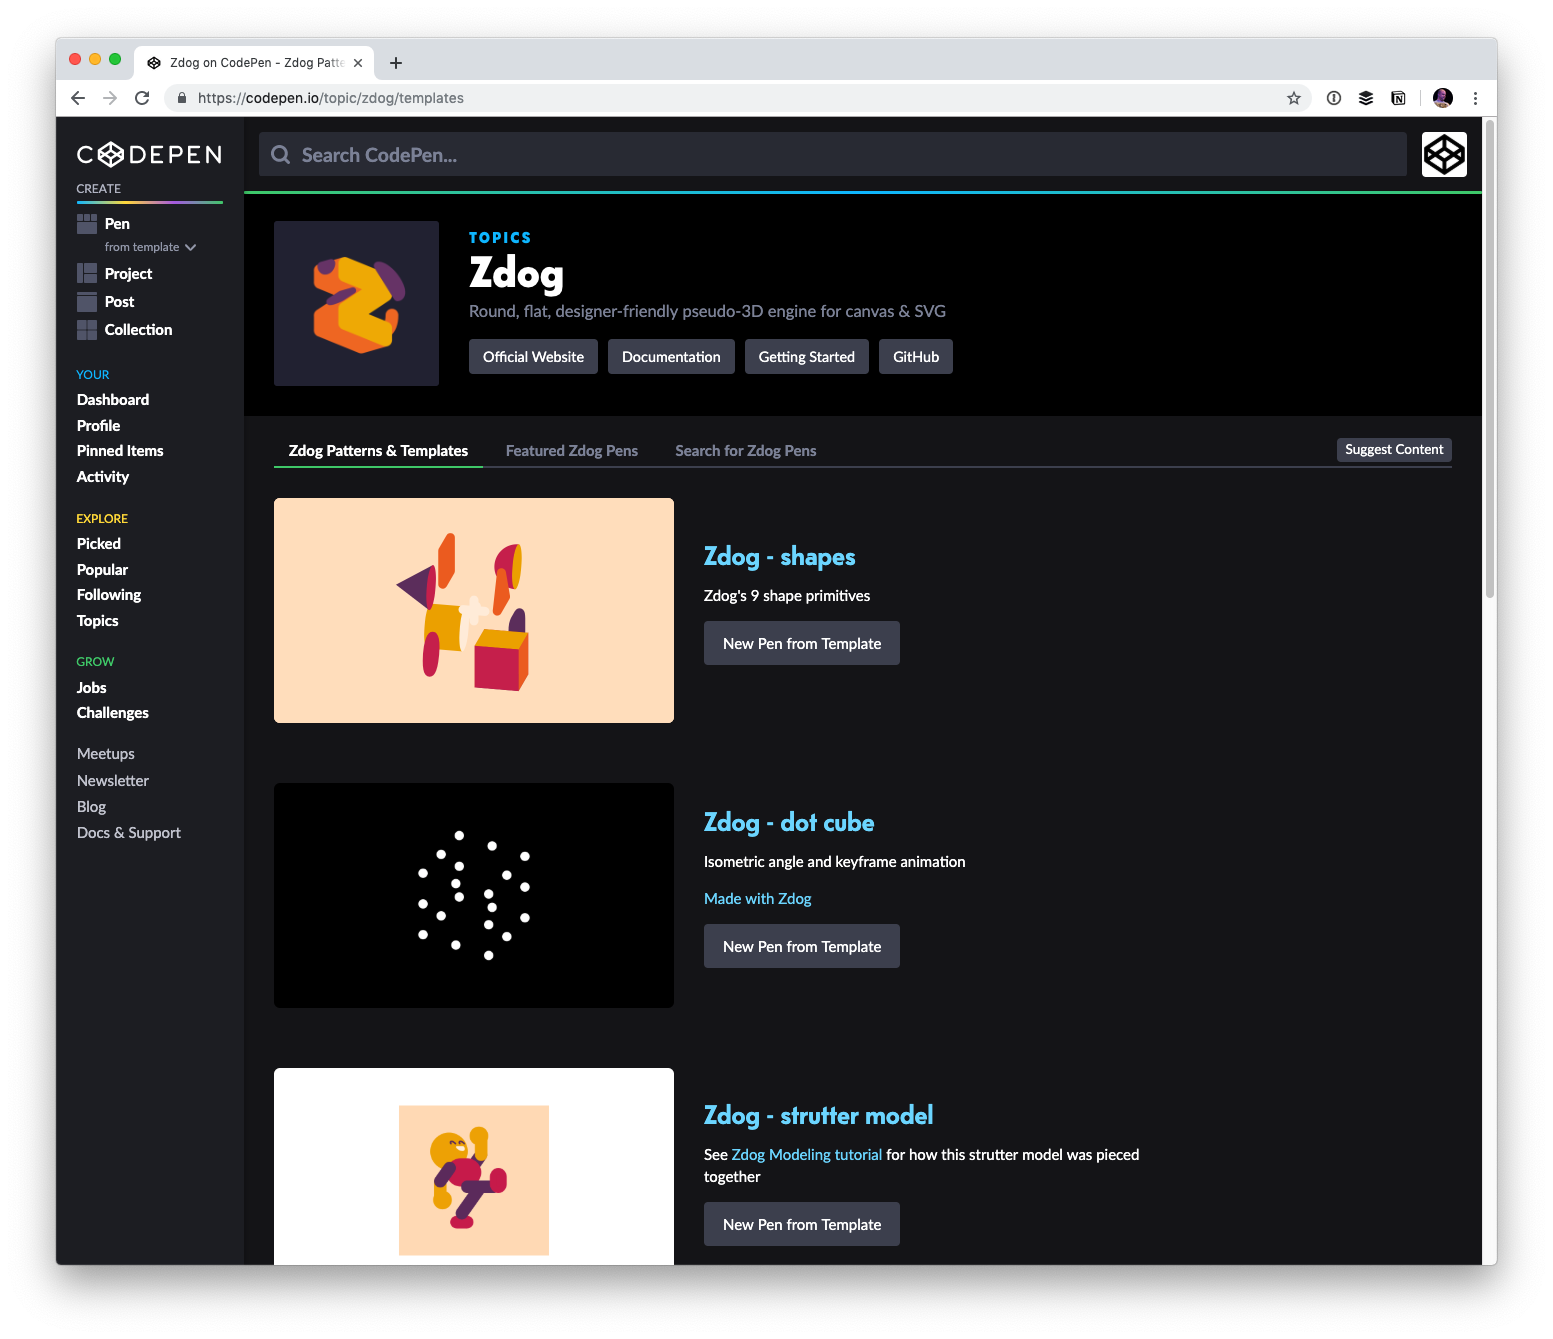
David DeSandro has loads of super cool JavaScript libraries he's created over the years. His latest is Zdog, a "round, flat, designer-friendly pseudo-3D engine for canvas & SVG." It's only been about a month since he dropped it (although, like any good library, it's been simmering) and it has been pretty incredible to watch it capture the imagination of loads of designers and developers.
I'm shouting out Zdog here because I think it's worth y'all checking out. There is something about the API and how easy it becomes to draw in a 3D space that is clicking with folks. It might just click with you! Having a little moment like that is what web dev is all about ;).
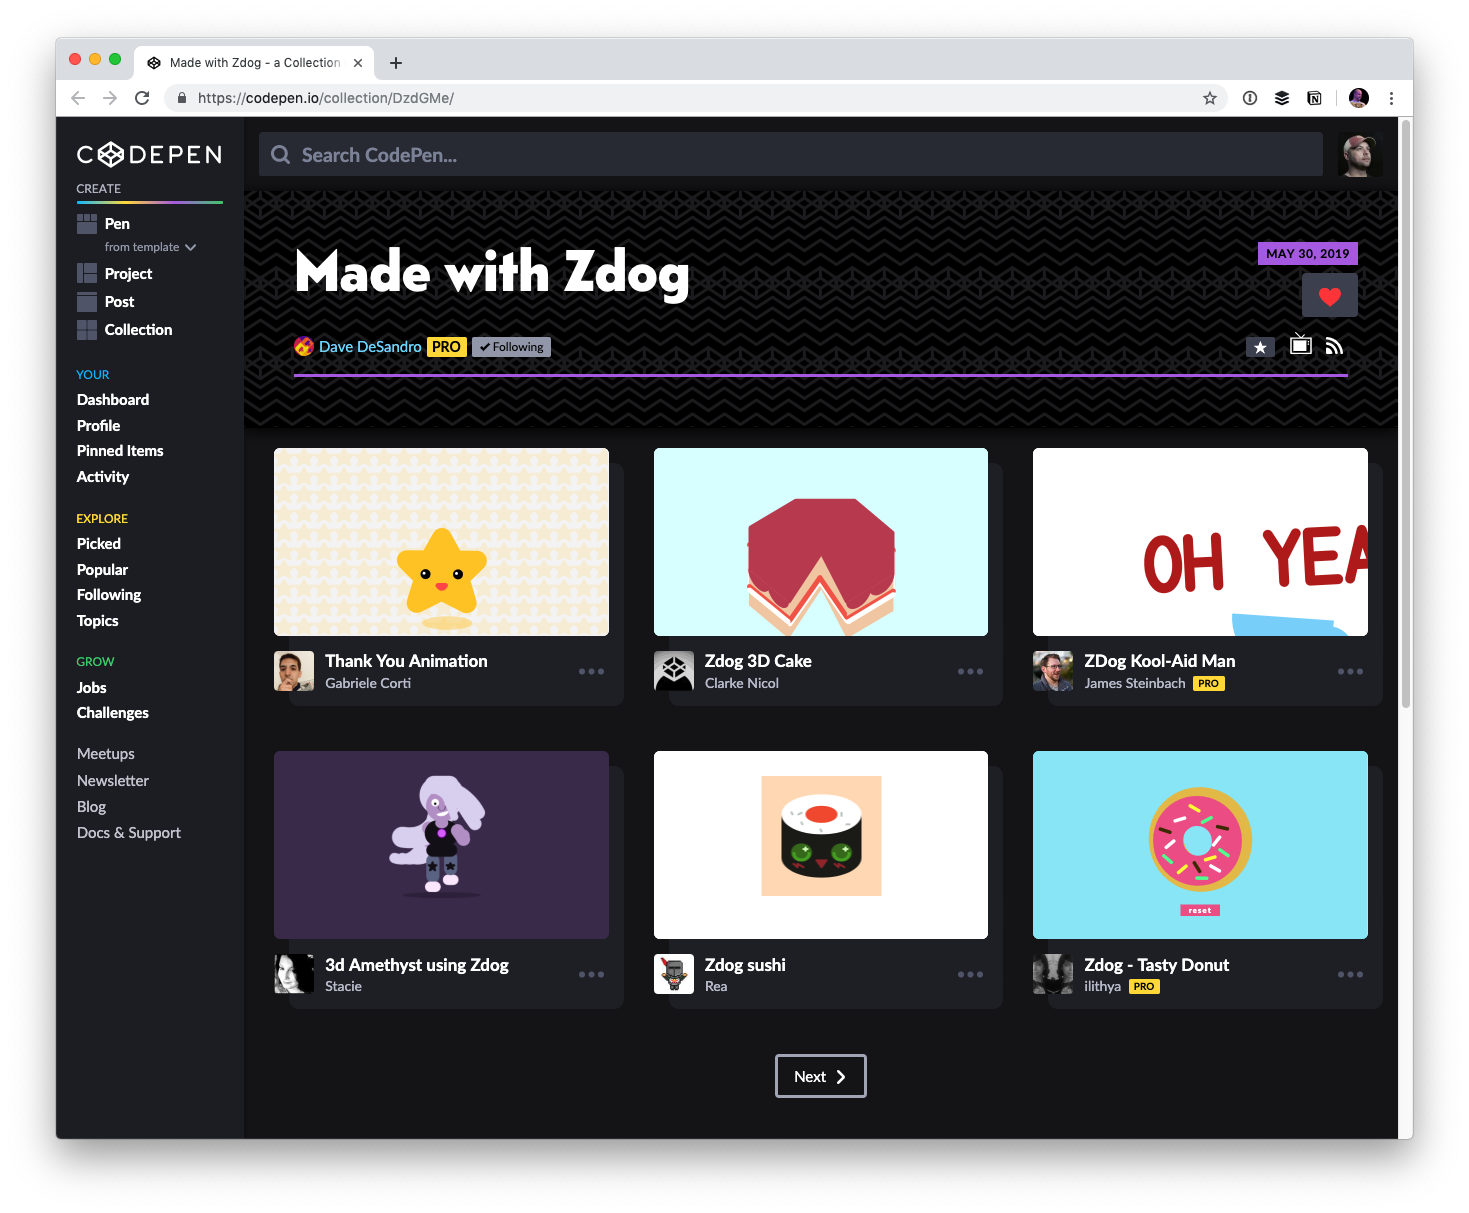
(By the way, if you have a good idea for a "Topic" on CodePen, let me know! The main thing we need is a good strong Collection of "starter" Pens to help people understand concepts and use the library, plus a Collection of strong, complete examples. I have some cool swag and stuff I could send your way if you're into the idea of helping.)
This demo shows one way to make a navigation that is visually distinct, usable and accessible. Using the provided code, you can create all sorts of variations on this theme. I encourage you to try your hand at modifying it in interesting ways.
The inspiration for this demo comes from the Dribbble shot Holidays Menu by BestServedBold.
Attention: This tutorial assumes that you are proficient with JavaScript. A familiarity with WebGL and PixiJS is useful, but not required to step through this. If you would like to become more familiar with either fragment shaders or PixiJS, visit:
With this basic setup we end up with a navigation that looks like this:
You can view the demo for this step here: Demo of step 1
Given this, we will write some JavaScript that builds out the navigation elements, and builds out a PixiJS application.
At that point it looks something like this:
Once we have this fundamental functionality in place, we can add the really fun stuff: shaders.
We’ll be building out two different shaders (or, in PixiJS’s nomenclature: filters). One for the screen as a whole that distorts and blurs the navigation. The second is the shader that renders the buttons on hover or focus.
So, with our general approach in place, let’s dive in.
Building the navigation class
For this tutorial, I’m going to focus on the JavaScript. In the source you’ll find the fully commented JavaScript and shader code. I will not be covering the fundamentals of GLSL or fragment shader programming here, for that please see The Book of Shaders.
Initialisation
The very first thing we want to do is set up the basic initialisation functionality. In the main.js file you’ll find the following:
// Create the navigation based on the nav element
const nav = new Navigation(document.querySelector('.main-nav'));

// Load the web font and, once it's loaded, initialise the nav.
WebFont.load({
  google: {
    families: ['Abril Fatface']
  },
  active: () => {
    nav.init();
    nav.focusNavItemByIndex(0);
  }
});
The above code creates the Navigation instance, supplying it with the navigation HTML element – document.querySelector('.main-nav'). Then it initialises the font load for Abril Fatface and, once that’s loaded, initialises the navigation.
Navigation class structure
Following is the basic class structure for the Navigation class:
/**
 * This class provides encapsulates the navigation as a whole. It is provided the base
 * navigation element which it reads and recreates in the Pixi application
 *
 * @class Navigation
 * @author Liam Egan
 * @version 1.0.0
 * @created Mar 20, 2019
 */
class Navigation {

  /**
   * The Navigation constructor saves the navigation element and binds all of the
   * basic listener methods for the class.
   *
   * The provided nav element should serve as both a container to the pixi canvas
   * as well as containing the links that will become the navigation. It's important
   * to understand that any elements within the navigation element that might appear
   * will be covered by the application canvas, so it should serve only as a
   * container for the navigation links and the application canvas.
   *
   * @constructor
   * @param {HTMLElement} nav         The navigation container.
   */
  constructor(nav) { }

  /**
   * Initialises the navigation. Creates the navigation items, sets up the pixi
   * application, and binds the various listeners.
   *
   * @public
   * @return null
   */
  init() { }

  /**
   * Initialises the Navigation item elements, initialising their canvas
   * renditions, their pixi sprites and initialising their interactivity.
   *
   * @public
   * @return null
   */
  makeNavItems() { }

  /**
   * Public methods
   */

  /**
   * Initialises the Navigation item as a canvas element. This takes a string and renders it
   * to the canvas using fillText.
   *
   * @public
   * @param {String} title      The text of the link element
   * @return {Canvas}           The canvas alement that contains the text rendition of the link
   */
  makeNavItem(title) { }

  /**
   * Initialises the PIXI application and appends it to the nav element
   *
   * @public
   * @return null
   */
  setupWebGLContext() { }

  /**
   * Given a numeric index, this calculates the position of the
   * associated nav element within the application and simulates
   * a mouse move to that position.
   *
   * @public
   * @param {Number} index      The index of the navigation element to focus.
   * @return null
   */
  focusNavItemByIndex(index) { }

  /**
   * Removes all of the event listeners and any association of
   * the navigation object, preparing the instance for garbage
   * collection.
   *
   * This method is unused in this demo, but exists here to
   * provide somewhere for you to remove all remnents of the
   * instance from memory, if and when you might need to.
   *
   *
   * @public
   * @return null
   */
  deInit() { }

  /**
   * Redraws the background graphic and the container mask.
   *
   * @public
   * @return null
   */
  setupBackground() { }

  /**
   * Coerces the mouse position as a vector with units in the 0-1 range
   *
   * @public
   * @param {Array} mousepos_px      An array of the mouse's position on screen in pixels
   * @return {Array}
   */
  fixMousePos(mousepos_px) { }


  /**
   * Event callbacks
   */

  /**
   * Responds to the window resize event, resizing the stage and redrawing
   * the background.
   *
   * @public
   * @param {Object} e     The event object
   * @return null
   */
  onResize(e) { }

  /**
   * Responds to the window pointer move event, updating the application's mouse
   * position.
   *
   * @public
   * @param {Object} e     The event object
   * @return null
   */
  onPointerMove(e) { }

  /**
   * Responds to the window pointer down event, creating a timeout that checks,
   * after a short period of time, whether the pointer is still down, after
   * which it sets the dragging property to true.
   *
   * @public
   * @param {Object} e     The event object
   * @return null
   */
  onPointerDown(e) { }

  /**
   * Responds to the window pointer up event, sets pointer down to false and,
   * after a short time, sets dragging to false.
   *
   * @public
   * @param {Object} e     The event object
   * @return null
   */
  onPointerUp(e) { }


  /**
   * Getters and setters (properties)
   */

  /**
   * (getter/setter) The colour of the application background. This can take
   * a number or an RGB hex string in the format of '#FFFFFF'. It stores
   * the colour as a number
   *
   * @type {number/string}
   * @default 0xF9F9F9
   */
  set backgroundColour(value) { }
  get backgroundColour() { }

  /**
   * (getter/setter) The position of the mouse/pointer on screen. This
   * updates the position of the navigation in response to the cursor
   * and fixes the mouse position before passing it to the screen
   * filter.
   *
   * @type {Array}
   * @default [0,0]
   */
  set mousepos(value) { }
  get mousepos() { }

  /**
   * (getter/setter) The amount of padding at the edge of the screen. This
   * is sort of an arbitrary value at the moment, so if you start to see
   * tearing at the edge of the text, make this value a little higher
   *
   * @type {Number}
   * @default 100
   */
  set maskpadding(value) { }
  get maskpadding() { }
}
The Navigation constructor is given the nav HTML element and it initialises all of the basic properties of the class
  constructor(nav) {
    // Save the nav
    this.nav = nav;

    // Set up the basic object property requirements.
    this.initialised = false;   // Whether the navigation is already initialised
    this.navItems = [];         // This will contain the generic nav item objects
    this.app = null;            // The PIXI application
    this.container = null;      // The PIXI container element that will contain the nav elements
    this.screenFilter = null;   // The screen filter to be appliced to the container
    this.navWidth = null;       // The full width of the navigation
    this.background = null;     // The container for the background graphic
    this.pointerdown = false;   // Indicates whether the user's pointer is currently down on the page
    this.dragging = false;      // Indicates whether the nav is currently being dragged. This is here to allow for both the dragging of the nav and the tapping of elements.

    // Bind the listener methods to the class instance
    this.onPointerMove = this.onPointerMove.bind(this);
    this.onPointerDown = this.onPointerDown.bind(this);
    this.onPointerUp = this.onPointerUp.bind(this);
    this.onResize = this.onResize.bind(this);
  }
Building the navigation elements
Once the class is constructed and the fonts are loaded, we initialise the navigation.
The first part of building out the PixiJS application is to create the navigation items. PixiJS uses specialised objects for the display of various elements that, at their root, are images. So the first thing we need to do is initialise an array of all of the nav items that we want. Within our init method, we see the following:
// Find all of the anchors within the nav element and create generic object
    // holders for them.
    const els = this.nav.querySelectorAll('a');
    els.forEach((el) => {
      this.navItems.push({
        rootElement:  el,             // The anchor element upon which this nav item is based
        title:        el.innerText,   // The text of the nav item
        element:      null,           // This will be a canvas representation of the nav item
        sprite:       null,           // The PIXI.Sprite element that will be appended to stage
        link:         el.href         // The link's href. This will be used when clicking on the button within the nav
      });
    });
This code loops through the anchor elements within the navigation and initialises the basic objects for use by the navigation class. Once this is done we can move onto actually creating the basic nav elements:
makeNavItem(title) {
    if(!this.initialised) return;

    const c = document.createElement('canvas');
    const ctx = c.getContext('2d');

    const font = 'Abril Fatface';
    const fontSize = 80;

    ctx.font = `${fontSize}px ${font}`; // This is here purely to run the measurements

    c.width = ctx.measureText(title).width + 50;
    c.height = fontSize*1.5;

    ctx.font = `${fontSize}px ${font}`;
    ctx.textAlign="center";
    ctx.textBaseline="bottom";
    ctx.fillStyle = "rgba(40,50,60,1)";
    ctx.fillText(title, c.width*.5, c.height-fontSize*.2);

    return c;
  }
The above code takes a title (provided by a loop in the makeNavItems method), it creates a canvas element, initialises the font, and writes out the text onto the canvas.
The reason we do this instead of writing the text directly into PixiJS is that font rendition in canvas is more predictable and reliable. Doing so also provides us with the opportunity to add other canvas styling such as text strokes, or shadows.
Initialising the PixiJS application
Following is the method uses to initialise the PixiJS application:
setupWebGLContext() {
    if(!this.initialised) return;

    // Create the pixi application, setting the background colour, width and
    // height and pixel resolution.
    this.app = new PIXI.Application({
      backgroundColor: this.backgroundColour,
      width: window.innerWidth,
      height: window.innerHeight,
      resolution: 2
    });
    // Ofsetting the stage to the middle of the page. I find it easier to
    // position things to a point in the middle of the window, so I do this
    // but you might find it easier to position to the top left.
    this.app.stage.x = window.innerWidth * .5;
    this.app.stage.y = window.innerHeight * .5;
This initialises the application and rearranges the stage to the middle of the window.
// Create the container and apply the screen filter to it.
    this.container = new PIXI.Container();
    this.screenFilter = new ScreenFilter(2);
    this.app.stage.filters = [this.screenFilter];
This creates the object that contains the navigation itself and applies to it the screen filter.
// Measure what will be the full pixel width of the navigation
    // Then loop through the nav elements and append them to the containter
    let ipos = 0;                                 // The tracked position for each element in the navigation
    this.navWidth = 0;                            // The full width of the navigation
    this.navItems.forEach((item) => {
      this.navWidth += item.sprite.width;
    });
    this.navItems.forEach((item) => {
      item.sprite.x = this.navWidth * -.5 + ipos; // Calculate the position of the nav element to the nav width
      ipos += item.sprite.width;                  // update the ipos
      this.container.addChild(item.sprite);       // Add the sprite to the container
    });
This code loops through the navigation items and calculates their positions inside the PixiJS application.
// Create the background graphic
    this.background = new PIXI.Graphics();
    this.setupBackground();

    // Add the background and the container to the stage
    this.app.stage.addChild(this.background);
    this.app.stage.addChild(this.container);
Sets up the background and attaches it and the container to the stage.
// Set the various necessary attributes and class for the canvas
    // elmenent and append it to the nav element.
    this.app.view.setAttribute('aria-hidden', 'true');    // This just hides the element from the document reader (for sight-impaired people)
    this.app.view.setAttribute('tab-index', '-1');        // This takes the canvas element out of tab order completely (tabbing will be handled programatically using the actual links)
    this.app.view.className = 'main-nav__canvas';         // Add the class name
    this.nav.appendChild(this.app.view);                  // Append the canvas to the nav element
  }
Finally we set some basic properties to the application’s canvas element and we attach it to the nav element that was provided to the class constructor.
Making it interactive
makeNavItems() {
    if(!this.initialised) return;

    // Loop through the navItems object
    this.navItems.forEach((navItem, i) => {
      // Make the nav element (the canvas rendition of the anchor) for this item.
      navItem.element = this.makeNavItem(navItem.title, navItem.link);

      // Create the PIXI sprite from the canvas
      navItem.sprite = PIXI.Sprite.from(navItem.element);

      // Turn the sprite into a button and initialise the various event listeners
      navItem.sprite.interactive = true;
      navItem.sprite.buttonMode = true;
      const filter = new HoverFilter();
      // This provides a callback for focus on the root element, providing us with
      // a way to cause navigation on tab.
      navItem.rootElement.addEventListener('focus', ()=> {
        this.focusNavItemByIndex(i);
        navItem.sprite.filters = [filter];
      });
      navItem.rootElement.addEventListener('blur', ()=> {
        navItem.sprite.filters = [];
      });
      // on pointer over, add the filter
      navItem.sprite.on('pointerover', (e)=> {
        navItem.sprite.filters = [filter];
      });
      // on pointer out remove the filter
      navItem.sprite.on('pointerout', (e)=> {
        navItem.sprite.filters = [];
      });
      // On pointer up, if we're not dragging the navigation, execute a click on
      // the root navigation element.
      navItem.sprite.on('pointerup', (e)=> {
        if(this.dragging) return;
        navItem.rootElement.click();
      });
    });
  }
This method loops through the navItems array creating the nav item canvas element, initialising the PixiJS Sprite element using this canvas, then attaching listeners to various interactions.
Note that in order for a PixiJS sprite to be able to react to mouse events in this way it needs to have its interactuve and buttonMode properties set to true
The reasons and functions of the listeners here is as follows:
rootElement:focus
This listens to the focus event of the anchor element that defines this button. It then tells the application to move to this nav item and add the filter we use for mouse hover.
rootElement:blur
Triggered when focus leaves the element. This simply removes the filter
navItem.pointerover
Adds the hover filter
navItem.pointerout
Removes the hover filter
navItem.pointerup
This listens to the pointer up event on the nav item and, if the user isn’t dragging the nav (this check is here for touch devices), then a click event is triggered on the root element.
In addition to the above, we also add stage-level listeners that provide the overall movement functionality to the navigation. The reasons and functions of the listeners here is as follows:
onPointerMove
This method updates the mouse position when the pointer moves and sends it to the application.
onPointerDown
This picks up when the pointer has been pressed and starts a timeout that determines whether the intention of the pointer being down was to drag the navigation. This makes sure that touch users can use both the navigation and buttons.
onPointerUp
Resets both the pointerdown and dragging property
How PixiJS filters work
In PixiJs nomenclature, a filter is a class that is a wrapper around a fragment shader. The basic code to apply a filter to a PixiJS display object is:
const screenFilter = new ScreenFilter(2);
displayObject.filters = [this.screenFilter];
And for the whole time that filter sits in the array of that display object it will be rendered in place of the display object.
There are many ways to write filters for PixiJS but for our purposes we’re going to write classes that extend PIXI.Filter because we want to run a little extra code during the render loop for the filter.
The PixiJS filter itself creates a fragment shader and allows that shader to be run over any PixiJS display object, providing the ability to read the pixels that make up the object and limiting the render area to the bounds of that display object. This is very powerful as it limits the computational power required to run the shader.
For this demo, I’ve written two filters. One will run over the buttons themselves as they’re hovered or focused, the other will run over the navigation container itself.
Writing the filter for button hover
This filter runs only on the buttons and only when the buttons have been hovered or focused. It’s a reasonably straightforward filter that updates a time variable every frame for the purpose of animating some noise in the fragment shader. Please see the HoverFilter.fragmentSrc method for more information.
Writing the filter for the screen distortion
This filter runs on the display object for the navigation group of elements itself. It distorts and blurs the navigation in a radius around the position of the user’s mouse and, in combination with the animation of the navigation itself, this provides a sense of refraction, and distortion like looking at the navigation under water. Please see the ScreenFilter.fragmentSrc method for more information.
Making it accessible
We should be making websites for everybody. So this demo attempts to make a functional element that can be used by anybody. Keyboard users and screen readers are able to consume this navigation as easily as they would a normal website navigation and this is in thanks to the use of focus listeners.
Closing thoughts
In this demo we see that the power of webGL is wonderful. With it we can create really new and exciting things, and it allows us to take old ideas and make them new again.
In the source code for this demo you’ll be able to see how I’ve constructed the shaders that control the appearance of the navigation. In the process of building this I’ve tried to be as clear and straightforward as possible, so please try your hand at modifying the code. I would love to see what you can create with this basic setup, feel free to @me or message me on Twitter with anything you may think of.
I was recently a guest editor for an issue of Bizarro Devs. It's a great newsletter! Go sign up! I put in a bunch of links around blobs. Like those weird squishy random shapes that are so "in" right now. Here are those links as well. I'm always a fan of publishing stuff I write ;)
Blobs! Blobs are in! Blobs are — ahem — a bit bizarre. I'll bask in a design like this annual report cover by Matt Pamer all day. I enjoy watching a design trend like this manifest itself in design tooling and become applied in lots of creative and crafty different ways.
We could start with <svg> and draw our own blob using the Pen tool that is pretty much stock in every vector design application. I'm a cheater though, and would probably wind up checking The Noun Project for some blob examples and steal the SVG from there. But sadly, there isn't much there, at least as far as blobs go.
Once we have a blob, it's just begging to be moved around. Monica Dinculescu shows how to do just that with pure CSS and liberal use of various CSS transforms in a keyframe animation:
A library like Greensock could help moving and morphing the blobs around. Greensock even has a plugin that is probably the most powerful morphing tool out there. This Pen uses Greensock, but adds some native SVG filters so that the blobs squish into each other satisfyingly. We could call it the gooey effect:
And blobs don't have to be alone! Blobs that are squished together are like fluid. You might get a kick out of Peeke Kuepers article Simulating blobs of fluid.
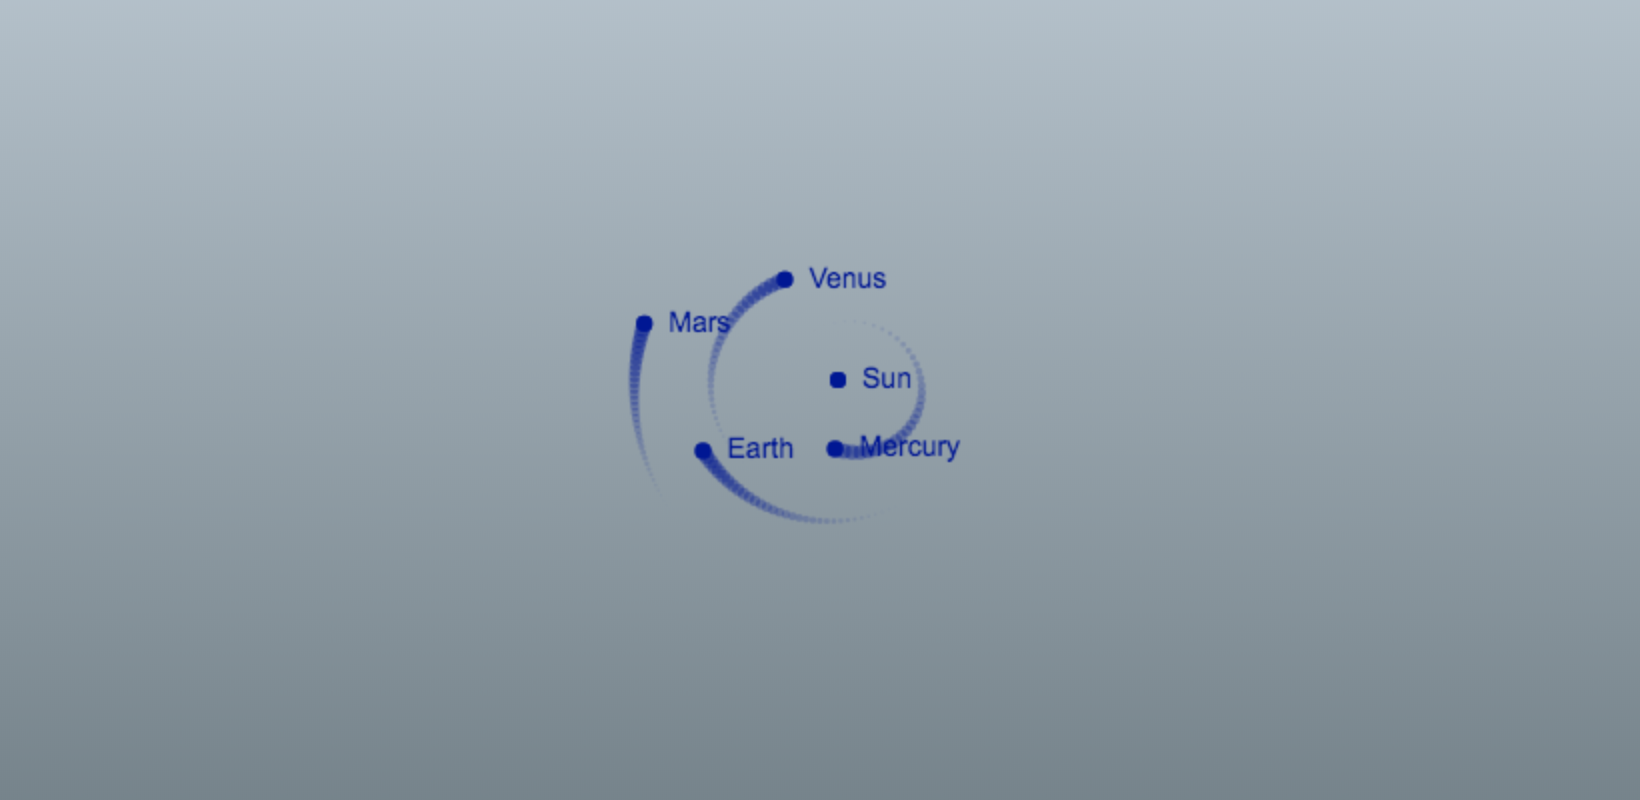
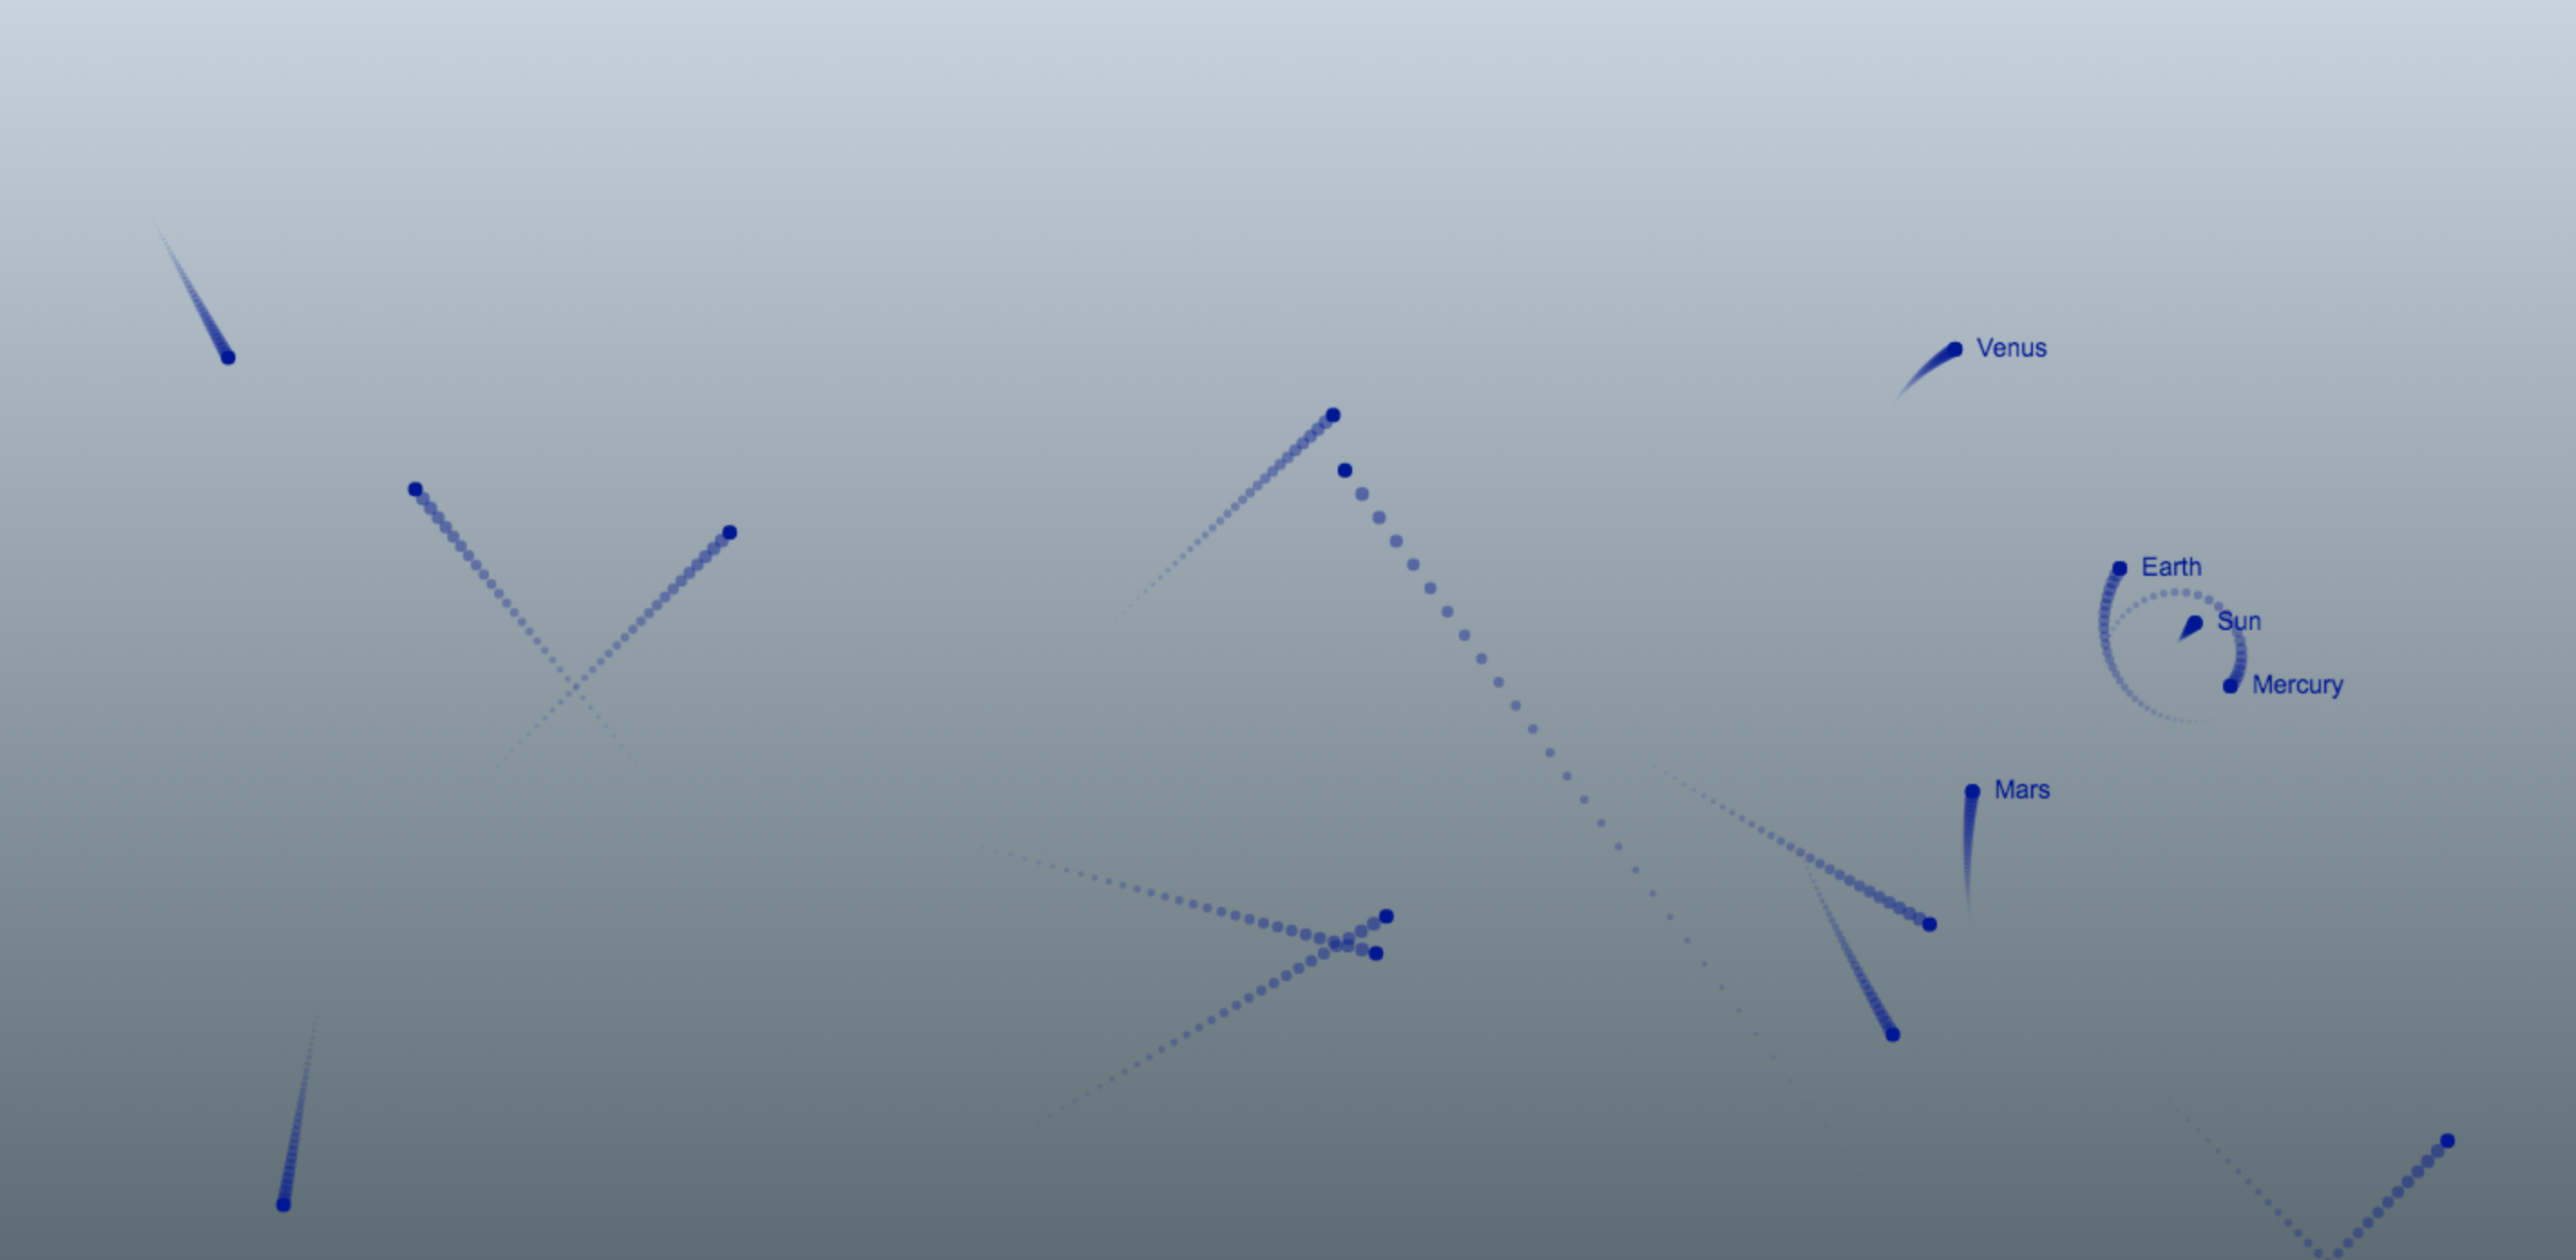
Space is vast. Space is awesome. Space is difficult to understand — or so people tend to think. But in this tutorial I am going to show you that this is not the case. Quite the contrary; the laws that govern the motion of the stars, planets, asteroids and even entire galaxies are incredibly simple. You could argue that if our Universe was created by a developer, she sure was concerned about writing clean code that would be easy to maintain and scale.
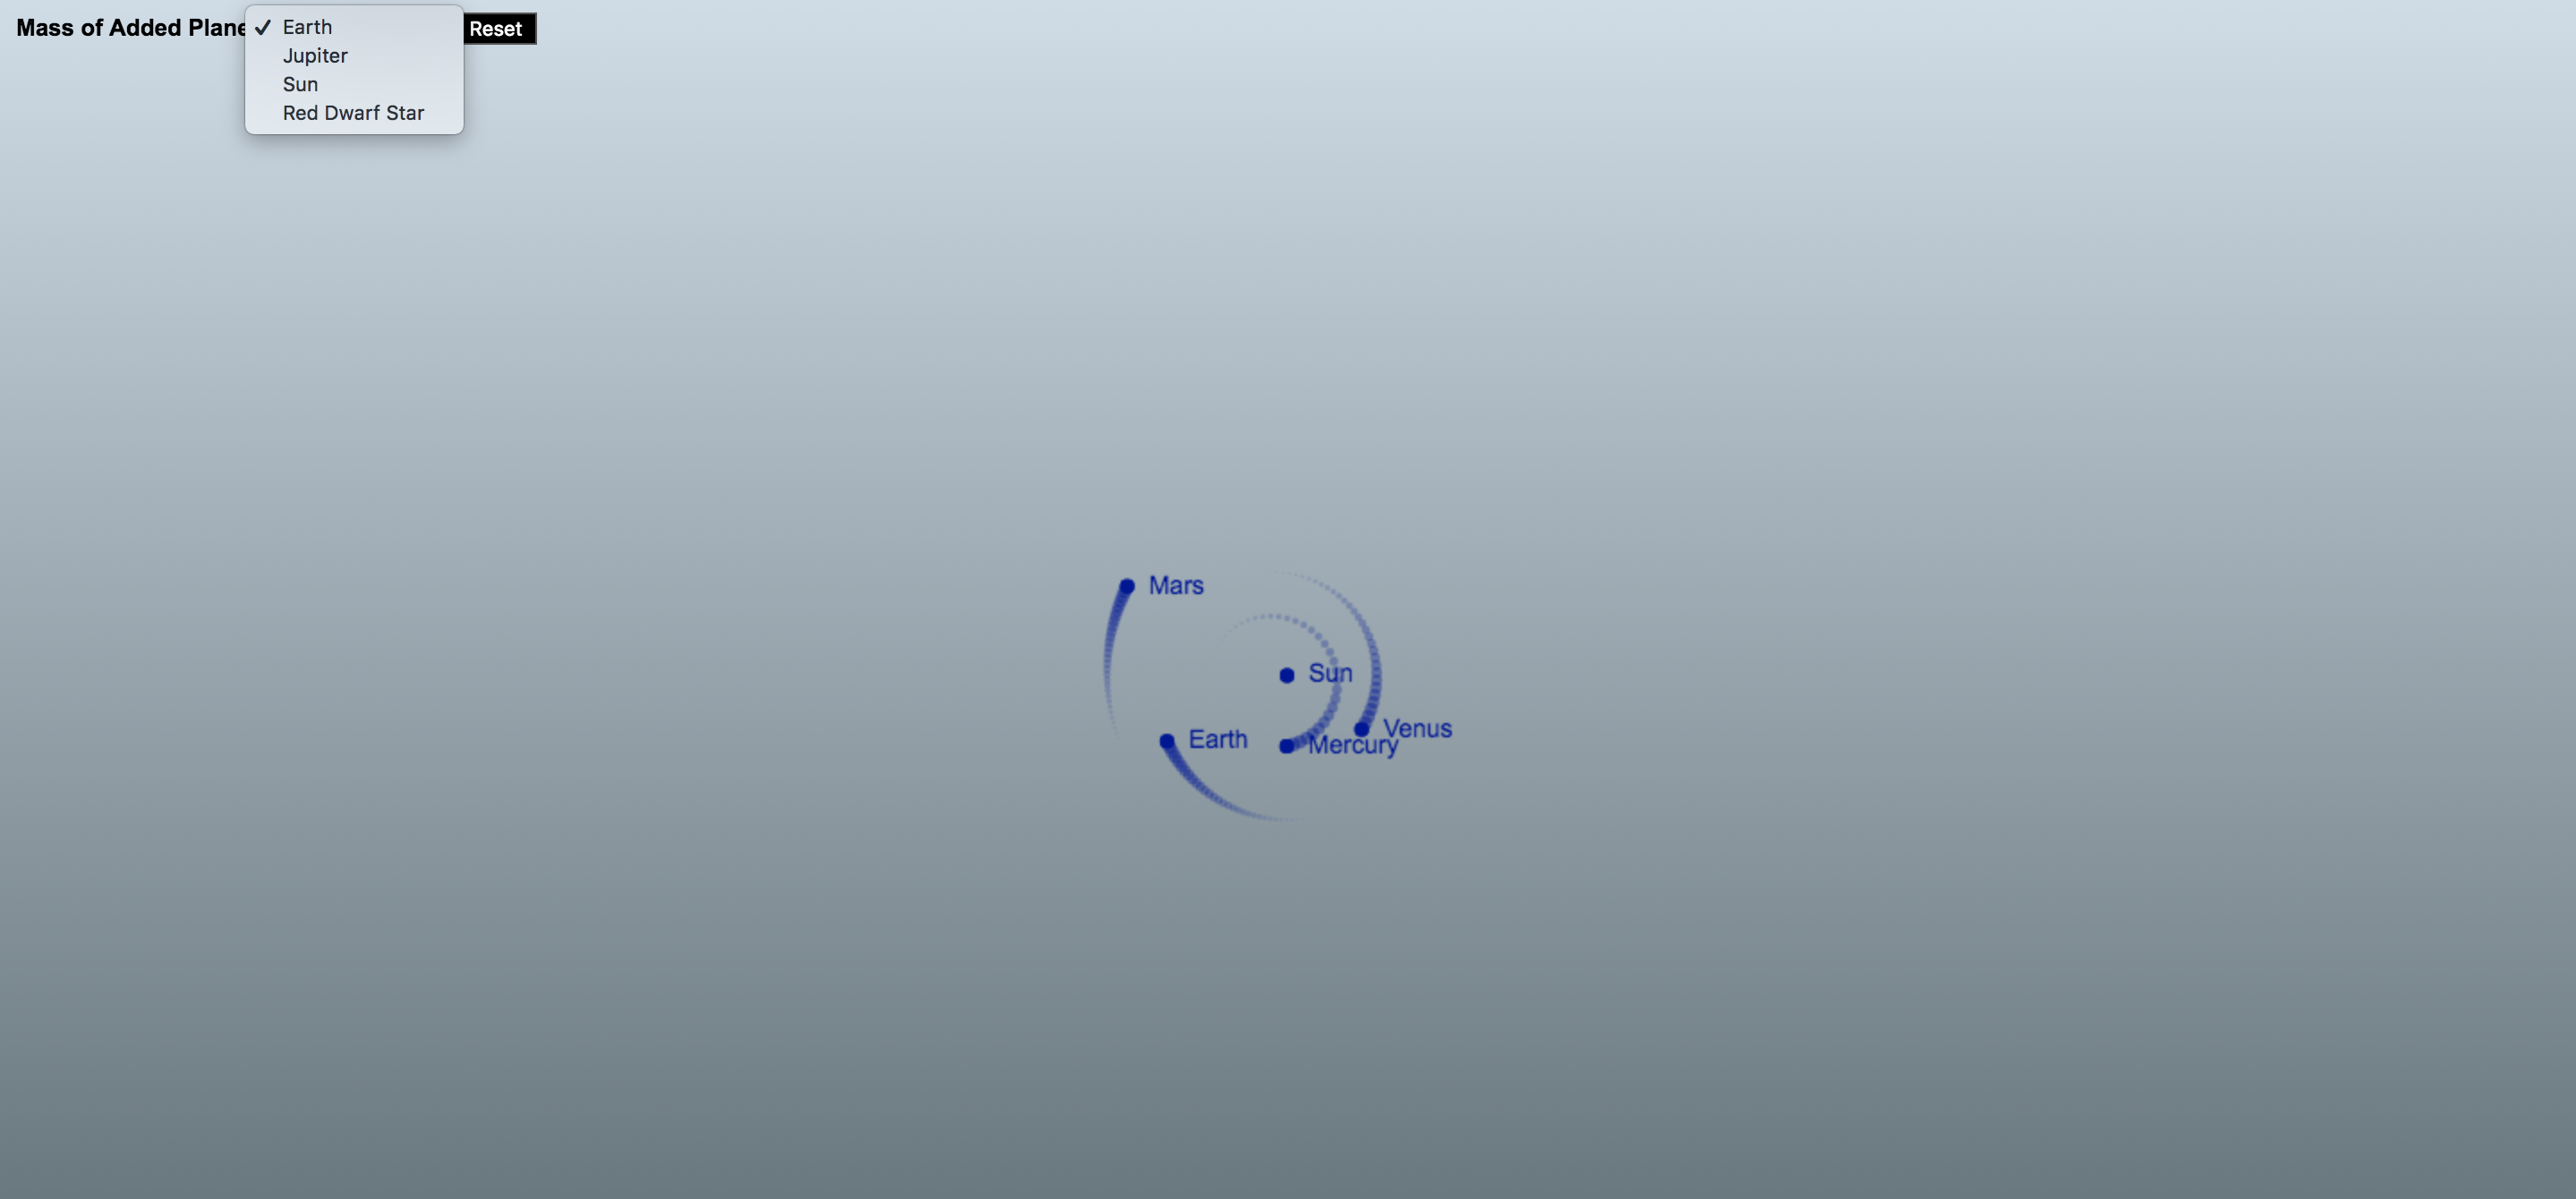
What we are going to do is create a simulation of the inner region of our solar system using nothing but plain old JavaScript. It will be a gravitational n-body simulation where every mass feels the gravity of all the other masses being simulated. To spice things up, I will also show how you can enable users of your simulator to add planets of their own to the simulation with nothing but a little bit of mouse drag action, and in doing so, cause all sorts of cosmic mayhem. A gravity or space simulator would not be worthy of its name without motion trails, so I will show you how to create some fancy looking trails, too, in addition to some other shenanigans that will make the simulator a little bit more fun for the average user.
You will find the complete source code for this project in the Pen above. There is nothing fancy going on there. No bundling of modules, or transpilation of TypeScript or JSX into JavaScript; just HTML markup, CSS, and a healthy dose of JavaScript.
I came up with the idea for this while working on a project that is close to my heart, namely Harmony of the Spheres. Harmony of the Spheres is open source and very much a work in progress, so if you enjoy this tutorial and got your appetite for all things space and physics related going, check out the repository and fire away a pull request if you find a bug or have a cool new feature that you would like to see implemented.
For this tutorial, it is assumed that you have a basic grasp of JavaScript and the syntax and features that were introduced with ES6. Also, if you are able to draw a rectangle onto a canvas element, that would help, too. If you are not yet in possession of this knowledge, I suggest you head over to MDN and start reading up on ES6 classes, arrow functions, shorthand notation for defining key-value pairs for object literals and const and let. If you are not quite sure how to set up a canvas animation, go check out the documentation on the Canvas API on MDN.
Part 1: Writing a Gravitational N-Body Algorithm
To achieve the goal outlined above, we are going to draw on numerical integration, which is an approach to solving gravitational n-body problems where you take the positions and velocities of all objects at a given time (T), calculate the gravitational force they exert on each other and update their velocities and positions at time (T + dt, dt being shorthand for delta time), or in other words, the change in time between iterations. Repeating this process, we can trace the trajectories of a set of masses through space and time.
We will use a Cartesian coordinate system for our simulation. The Cartesian coordinate system is based on three mutually perpendicular coordinate axes: the x-axis, the y-axis, and the z-axis. The three axes intersect at the point called the origin, where x, y and z are equal to 0. An object in a Cartesian space has a unique position that is defined by its x, y and z values. The benefit of using the Cartesian coordinate system for our simulation is that the Canvas API, with which we will visualize our simulation, uses it, too.
For the purpose of writing an algorithm for solving the gravitational n-body problem, it is necessary to have an understanding of what is meant by velocity and acceleration. Velocity is the change in position of an object with time, while acceleration is the change in an object's velocity with time. Newton's first law of motion stipulates that every object will remain at rest or in uniform motion in a straight line unless compelled to change its state by the action of an external force. The Earth does not move in a straight line, but orbits the Sun, so clearly it is accelerating, but what is causing this acceleration? As you have probably guessed, given the subject matter of this tutorial, the answer is the gravitational forces exerted on Earth by the Sun, the other planets in our solar system and every other celestial object in the Universe.
Before we discuss gravity, let us write some pseudo code for updating the positions and velocities of a set of masses in Cartesian space. We store our masses as objects in an array where each object represents a mass with x, y and z position and velocity vectors. Velocity vectors are prefixed with a v — v for velocity!
Looking at the code above, we can see that — as outlined in our discussion on numerical integration — every time we advance the simulation by a given time step, dt, we update the velocities of the masses being simulated and, with those velocities, we update the positions of the masses. The relationship between position and velocity is also made clear in the code above, as we can see that in one step of our simulation, the change in, for example, the x position vector of our mass is equal to the product of the mass's x velocity vector and dt. Similarly, we can make out the relationship between velocity and acceleration.
How, then, do we get the x, y and z acceleration vectors for a mass so that we can calculate the change in its velocity vectors? To get the contribution of massJ to the x acceleration vector of massI, we need to calculate the gravitational force exerted by massJ on massI, and then, to obtain the x acceleration vector, we simply calculate the product of this force and the distance between the two masses on the x axis. To get the y and z acceleration vectors, we follow the same procedure. Now we just have to figure out how to calculate the gravitational force exerted by massJ on massI to be able to write some more pseudo code. The formula we are interested in looks like this:
f = g * massJ.m / dSq * (dSq + s)^1/2
The formula above tells us that the gravitational force exerted by massJ on massI is equal to the product of the gravitational constant (g) and the mass of massJ (massJ.m) divided by the product of the sum of the squares of the distance between massI and massJ on the x, y and z axises (dSq) and the square root of dSq + s, where s is what is referred to as a softening constant (softeningConstant). Including a softening constant in our gravity calculations prevents a situation where the gravitational force exerted by massJ becomes infinite because it is too close to massI. This "bug," if you will, in the Newtonian theory of gravity arises for the reason that Newtonian gravity treats masses as point objects, which they are not in reality. Moving on, to get the net acceleration of massI along, for example, the x axis, we simply sum the acceleration induced on it by every other mass in the simulation.
Let us transform the above into code for updating the acceleration vectors of all the masses in the simulation.
const updateAccelerationVectors = (masses, g, softeningConstant) => {
  const massesLen = masses.length;

  for (let i = 0; i < massesLen; i++) {
    let ax = 0;
    let ay = 0;
    let az = 0;

    const massI = masses[i];

    for (let j = 0; j < massesLen; j++) {
      if (i !== j) {
        const massJ = masses[j];

        const dx = massJ.x - massI.x;
        const dy = massJ.y - massI.y;
        const dz = massJ.z - massI.z;

        const distSq = dx * dx + dy * dy + dz * dz;

        f = (g * massJ.m) / (distSq * Math.sqrt(distSq + softeningConstant));

        ax += dx * f;
        ay += dy * f;
        az += dz * f;
      }
    }

    massI.ax = ax;
    massI.ay = ay;
    massI.az = az;
  }
};
We iterate over all the masses in the simulation, and for every mass we calculate the contribution to its acceleration by the other masses in a nested loop and increment the acceleration vectors accordingly. Once we are out of the nested loop, we update the acceleration vectors of massI, which we can then use to calculate its new velocity vectors! Whowie. That was a lot. We now know how to update the position, velocity and acceleration vectors of n bodies in a gravity simulation using numerical integration.
But wait; there is something missing. That is right, we have talked about distance, mass and time, but we have never specified what units we ought to use for these quantities. As long as we are consistent, the choice is arbitrary, but generally speaking, it is a good idea to go for units that are suitable for the scales under consideration, so as to avoid awkwardly long numbers. In the context of our solar system, scientists tend to use astronomical units for distance, solar masses for mass and years for time. Adopting this set of units, the value of the gravitational constant (g in the formula for calculating the gravitational force exerted by massJ on massI) is 39.5. For the position and velocity vectors of the Sun and planets of the inner solar system — Mercury, Venus, Earth and Mars — we turn to NASA JPL's HORIZONS Web-Interface where we change the output setting to vector tables and the units to astronomical units and days. For whatever reason, Horizons does not serve vectors with years as the unit of time, so we have to multiply the velocity vectors by 365.25, the number of days in a year, to obtain velocity vectors that are consistent with our choice of years as the unit of time.
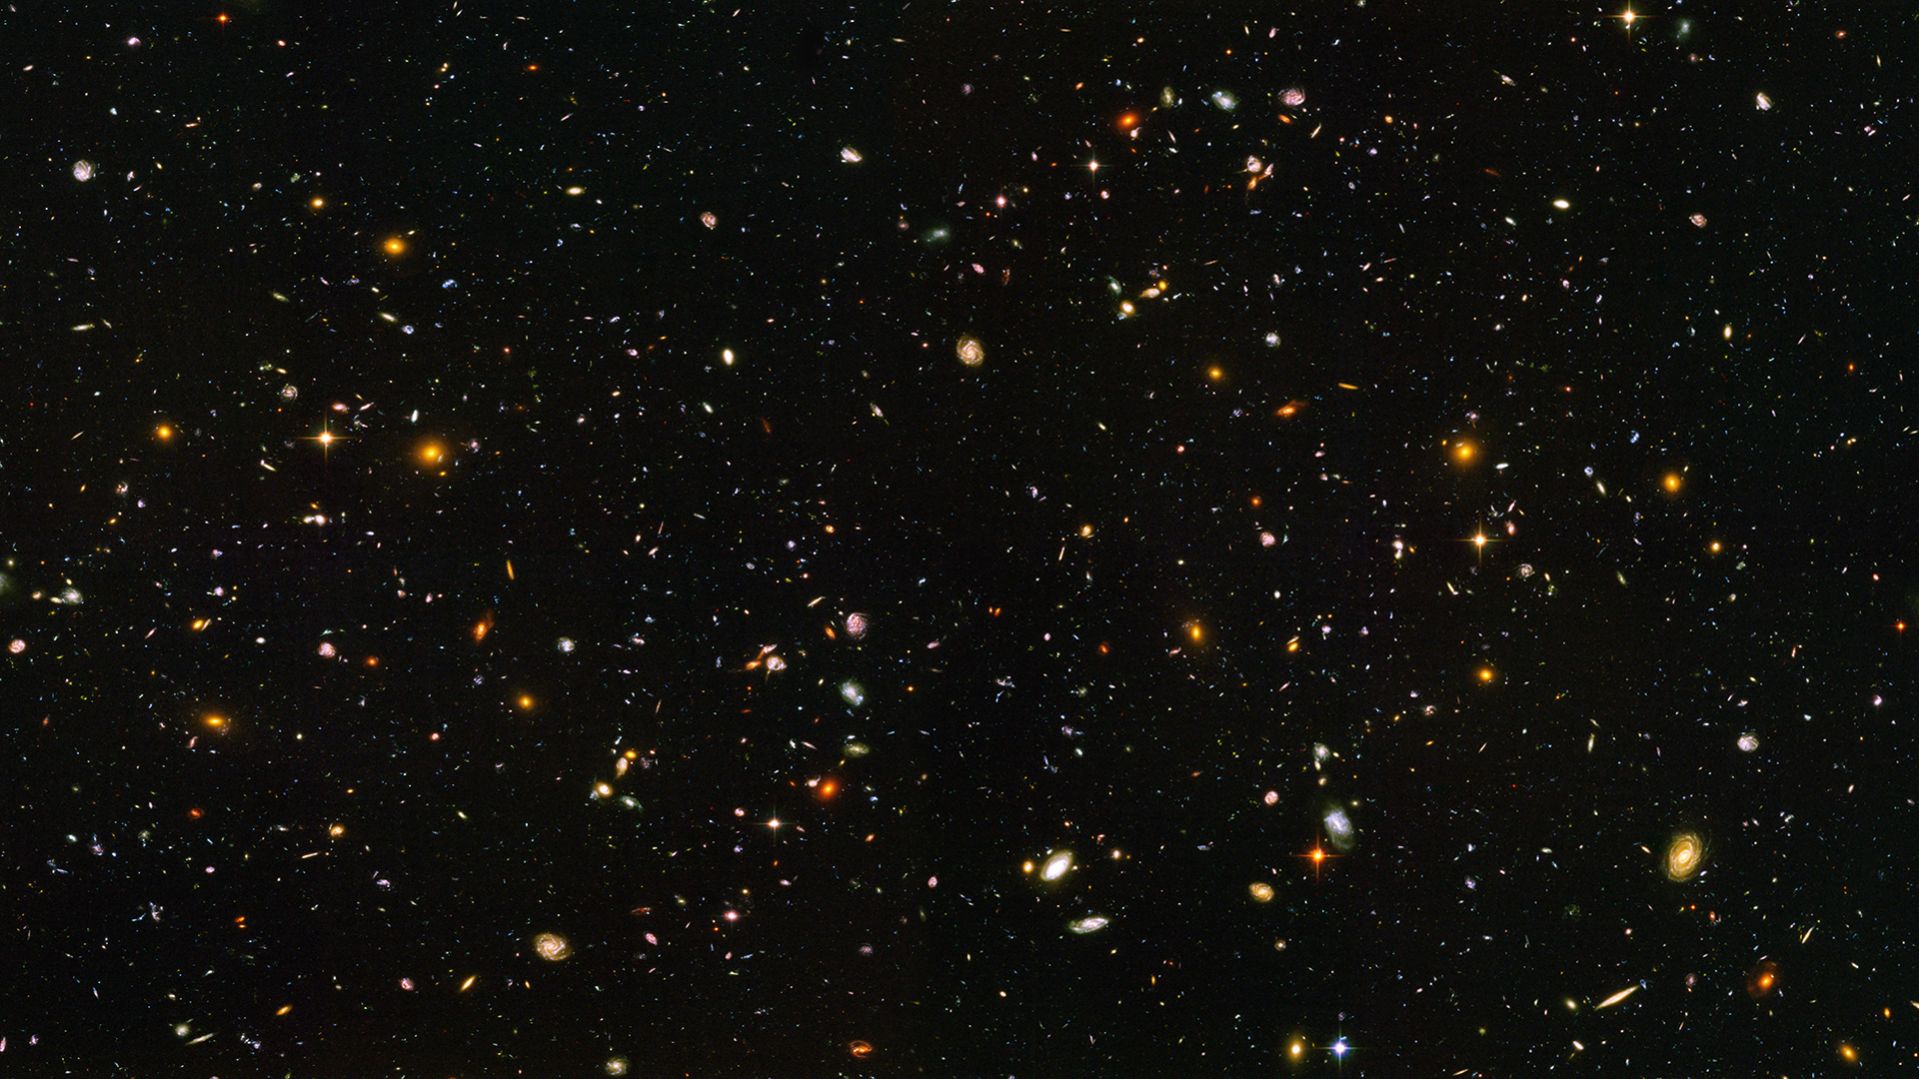
To think, that with the simple equations and laws discussed above, we can calculate the motion of every galaxy, star, planet and moon contained within this dazzling cosmic panorama captured by the Hubble Telescope, is nothing short of awe-inspiring. It is not for nothing Newton’s theory of gravity is referred to as "Newton’s law of universal gravitation."
A JavaScript class seems like an excellent way of encapsulating the methods we wrote above together with the data on the masses and the constants we need for our simulation, so let us do some refactoring:
class nBodyProblem {
  constructor(params) {
    this.g = params.g;
    this.dt = params.dt;
    this.softeningConstant = params.softeningConstant;

    this.masses = params.masses;
  }

  updatePositionVectors() {
    const massesLen = this.masses.length;

    for (let i = 0; i < massesLen; i++) {
      const massI = this.masses[i];

      massI.x += massI.vx * this.dt;
      massI.y += massI.vy * this.dt;
      massI.z += massI.vz * this.dt;
    }

    return this;
  }

  updateVelocityVectors() {
    const massesLen = this.masses.length;

    for (let i = 0; i < massesLen; i++) {
      const massI = this.masses[i];

      massI.vx += massI.ax * this.dt;
      massI.vy += massI.ay * this.dt;
      massI.vz += massI.az * this.dt;
    }
  }

  updateAccelerationVectors() {
    const massesLen = this.masses.length;

    for (let i = 0; i < massesLen; i++) {
      let ax = 0;
      let ay = 0;
      let az = 0;

      const massI = this.masses[i];

      for (let j = 0; j < massesLen; j++) {
        if (i !== j) {
          const massJ = this.masses[j];

          const dx = massJ.x - massI.x;
          const dy = massJ.y - massI.y;
          const dz = massJ.z - massI.z;

          const distSq = dx * dx + dy * dy + dz * dz;

          const f =
            (this.g * massJ.m) /
            (distSq * Math.sqrt(distSq + this.softeningConstant));

          ax += dx * f;
          ay += dy * f;
          az += dz * f;
        }
      }

      massI.ax = ax;
      massI.ay = ay;
      massI.az = az;
    }

    return this;
  }
}
That looks much nicer! Let us create an instance of this class. To do so, we need to specify three constants, namely the gravitational constant (g), the time step of the simulation (dt) and the softening constant (softeningConstant). We also need to populate an array with mass objects. Once we have all of those, we can create an instance of the nBodyProblem class, which we will call the innerSolarSystem, since, well, our simulation is going to be of the inner solar system!
const g = 39.5;
const dt = 0.008; // 0.008 years is equal to 2.92 days
const softeningConstant = 0.15;

const masses = [{
    name: "Sun", // We use solar masses as the unit of mass, so the mass of the Sun is exactly 1
    m: 1,
    x: -1.50324727873647e-6,
    y: -3.93762725944737e-6,
    z: -4.86567877183925e-8,
    vx: 3.1669325898331e-5,
    vy: -6.85489559263319e-6,
    vz: -7.90076642683254e-7
  }
  // Mercury, Venus, Earth and Mars data can be found in the pen for this tutorial
];

const innerSolarSystem = new nBodyProblem({
  g,
  dt,
  masses: JSON.parse(JSON.stringify(masses)),
  softeningConstant
});
At this moment, you are probably looking at how I instantiated the nBodyProblem class and asking yourself what is up with the JSON parsing and string-ifying nonsense. The reason for why I went about passing the data contained in the masses array to the nBodyProblem constructor in this way is that we want our users to be able to reset the simulation. However, if we pass the masses array itself to the constructor of the nBodyProblem class when we create an instance of it, and then set the value of the masses property of this instance to be equal to the masses array when the user clicks the reset button, the simulation would not have been reset; the state of the masses from the end of the previous simulation run would still be there, and so would any masses the user had added. To solve this problem, we need to pass a clone of the masses array when we instantiate the nBodyProblem class or reset the simulation, so as to avoid modifying the masses array, which we need to keep pristine and untouched, and the easiest way of cloning it is to simply parse a string-ified version of it.
Okay, moving on: to advance the simulation by one step, we simply call:
Congratulations. You are now one step closer to collecting a Nobel prize in physics!
Part 2: Creating a Visual Manifestation for our Masses
We could represent our masses with cute little circles created with the Canvas API's arc method, but that would look kind of dull, and we would not get a sense of the trajectories of our masses through space and time, so let us write a JavaScript class that will be our template for how our masses manifest themselves visually. It will create a circle that leaves a predetermined number of smaller and faded circles where it has been before, which conveys a sense of motion and direction to the user. The farther you get from the current position of the mass, the smaller and more faded out the circles will become. In this way, we will have created a pretty looking motion trail for our masses.
The constructor accepts three arguments, namely the drawing context for our canvas element (ctx), the length of the motion trail (trailLength) that represents the number of previous positions of our mass that the trail will visualize and finally the radius (radius) of the circle that represents the current position of our mass. In the constructor we will also initialize an empty array that we will call positions, which will — quell surprise — store the current and previous positions of the mass that are included in the motion trail.
At this point, our manifestation class looks like this:
How do we go about populating the positions array with positions and making sure that we do not store more positions than the number specified by the trailLength property? The answer is that we add a method to our class that accepts the x and y coordinates of the mass's position as arguments and stores them in an object in the array using the array push method, which appends an element to an array. This means that the current position of the mass will be the last element in the positions array. To make sure we do not store more positions than specified when we instantiated the class, we check if the length of the positions array is greater than the trailLength property. If it is, we use the array shift method to remove the first element, which represents the oldest stored position of the positions array.
class Manifestation {

  constructor() { /* The code for the constructor outlined above */ }

  storePosition(x, y) {
    this.positions.push({ x, y });

    if (this.positions.length > this.trailLength)
      this.positions.shift();
  }

}
Okay, let us write a method that draws our motion trail. As you have probably guessed, it will accept two arguments, namely the x and y positions of the mass we are drawing the trail for. The first thing we need to do is to store the new position in the positions array and discard any superfluous positions stored in it. Then we iterate over the positions array and draw a circle for every position and voilà, we have ourselves a motion trail! But it does not look very nice, and I promised you that our trail would be pretty with circles that would become increasingly smaller and faded out according to how close they were to the current position of our mass in time.
What we need is, clearly, a scale factor whose size depends on how far away the position we are drawing is from the current position of our mass in time! An excellent way of obtaining an appropriate scale factor, for our intents and purposes, is to simply divide the index (i) of the circle being drawn by the length of the positions array. For example, if the number of elements allowed in the positions array is 25, element number 23 in that array will get a scale factor of 23 / 25, which gives us 0.92. Element number 5, on the other hand, will get a scale factor of 5 / 25, which gives us 0.2; the scale factor decreases the further we get from the current position of our mass, which is the relationship we want! Do note that we need a condition that makes sure that if the circle being drawn represents the current position, the scale factor is set to 1, as we do not want that circle to be either faded or smaller, for that matter. With all this in mind, let us write the code for the draw method of our Manifestation class.
class Manifestation {

  constructor() { /* The code for the constructor outlined above */ }

  storePosition() { /* The code for the storePosition method discussed above */ }

  draw(x, y) {
    this.storePosition(x, y);

    const positionsLen = this.positions.length;

    for (let i = 0; i < positionsLen; i++) {
      let transparency;
      let circleScaleFactor;

      const scaleFactor = i / positionsLen;

      if (i === positionsLen - 1) {
        transparency = 1;
        circleScaleFactor = 1;
      } else {
        transparency = scaleFactor / 2;
        circleScaleFactor = scaleFactor;
      }

      this.ctx.beginPath();
      this.ctx.arc(
        this.positions[i].x,
        this.positions[i].y,
        circleScaleFactor * this.radius,
        0,
        2 * Math.PI
      );
      this.ctx.fillStyle = `rgb(0, 12, 153, ${transparency})`;

      this.ctx.fill();
    }
  }

}
Part 3: Visualizing Our Simulation
Let us write some canvas boilerplate and bind it together with the gravitational n-body algorithm and the motion trails, so that we can get an animation of our inner solar system simulation up and running. As mentioned in the introduction to this tutorial, I do not discuss the Canvas API in any great depth, as this is not an introductory tutorial on the Canvas API, so if you find yourself looking rather bemused and or perplexed, make haste and change this state of affairs by heading over to MDN’s documentation on the subject.
Before we continue, though, here is the HTML markup for our simulator:
Now, we turn to the interesting part: the JavaScript. We start by getting a reference to the canvas element and then we proceed by getting its drawing context. Next, we set the dimensions of our canvas element. When it comes to canvas animations on the web, I do not spare any expenses in terms of screen real estate, so let us set the width and height properties of the canvas element to the width and height of the browser window, respectively. You will notice that I have drawn on a peculiar syntax for setting the width and height of the canvas element in that I have declared, in one statement, that the width variable is equal to the width property of the canvas element which, in turn, is equal to the width of the window. Some developers frown upon the use of this syntax, but I find it to be semantically beautiful. If you do not feel the same way, you can deconstruct that statement into two statements. Generally speaking, do whatever you feel most comfortable with, or if you find yourself collaborating with others, what the team has agreed on.
At this point, we are going to declare some constants for our animation. More specifically, there are three of them. The first is the radius (radius) of the circle, which represents the current position of a mass, in pixels. The second is the length of our motion trail (trailLength), which is the number of previous positions that it includes. Last, but not least, we have the scale (scale) constant, which represents the number of pixels per astronomical unit; Earth is one astronomical unit from the Sun, so if we did not introduce this scale factor, our inner solar system would look very claustrophobic, to say the least.
Let us now turn to the visual manifestations of the masses we are simulating. We have written a class that encapsulates their behavior, but how do we instantiate and work with these manifestations in our code? The most convenient and elegant way would be to populate every element of the masses array we are simulating with an instance of the Manifestation class, so let us write a simple method that iterates over these masses and does just that, which we then invoke.
const populateManifestations = masses => {
  masses.forEach(
    mass =>
    (mass["manifestation"] = new Manifestation(
      ctx,
      trailLength,
      radius
    ))
  );
};

populateManifestations(innerSolarSystem.masses);
Our simulator is meant to be a playful affair, so it is only to be expected that users will spawn masses left and right and that after a minute, or so, the inner solar system will look like an unrecognizable cosmic mess, which is why I think it would be decent of us to provide them with the ability to reset the simulation. To achieve this goal, we start by attaching an event listener to the reset button, and then we write a callback for this event listener that sets the value of the masses property of the innerSolarSystem object to a clone of the masses array. As we cloned the masses array, we no longer have the manifestations of our masses in it, so we call the populateManifestations method to make sure that our users have something to look at after having reset the simulation.
Okay, enough setting things up. Let us breathe some life into the inner solar system by writing a method that, with the help of the requestAnimationFrame API, will run 60 steps of our simulation a second and animate the results with motion trails and labels for the planets of the inner solar system and the Sun.
The first thing this method does is advance the inner solar system by one step and it does so by updating the position, acceleration and velocity vectors of its masses. Then we prepare the canvas element for the next animation cycle by clearing it of what was drawn in the preceding animation cycle using the Canvas API’s clearRect method.
Next, we iterate over the masses array and invoke the draw method of each mass manifestation. Moreover, if the mass being drawn has a name, we draw it onto the canvas, so that the user can see where the original planets are after things have gone haywire. Looking at the code in the loop, you will probably notice that we are not setting, for example, the value of the mass’s x coordinate on the canvas to massI times scale, and that we are in fact setting it to the width of the viewport divided by two plus massI times scale. Why is this? The answer is that the origin (x = 0, y = 0) of the canvas coordinate system is set to the top left corner of the canvas element, so to center our simulation on the canvas where it is clearly visible to the user, we must include this offset.
After the loop, at the end of the animate method, we call requestAnimationFrame with the animate method as the callback, and then the whole process discussed above is repeated again, creating yet another frame — and run in quick succession, these frames have brought the inner solar system to life. But wait, we have missed something! If you were to run the code I have walked you through thus far, you would not see anything at all. Fortunately, all we have to do to change this sad state of affairs is to proverbially give the inner solar system a kick in its rear end (no, I am not going to fall for the temptation of inserting a Uranus joke here; grow up!) by invoking the animate method!
const animate = () => {
  innerSolarSystem
    .updatePositionVectors()
    .updateAccelerationVectors()
    .updateVelocityVectors();

  ctx.clearRect(0, 0, width, height);

  const massesLen = innerSolarSystem.masses.length;

  for (let i = 0; i < massesLen; i++) {
    const massI = innerSolarSystem.masses[i];

    const x = width / 2 + massI.x * scale;
    const y = height / 2 + massI.y * scale;

    massI.manifestation.draw(x, y);

    if (massI.name) {
      ctx.font = "14px Arial";
      ctx.fillText(massI.name, x + 12, y + 4);
      ctx.fill();
    }
  }

  requestAnimationFrame(animate);
};

animate();
Our visualization of Mercury, Venus, Earth and Mars going about their day-to-day business of running circles around the sun. Looks pretty neat.
Woah! We have now gotten to the point where our simulation is animated, with the masses represented by dainty little blue circles stalked by marvelous looking motion trails. That is pretty cool in itself, if you were to ask me; but I did promise to also show how you can enable the user to add masses of their own to the simulation with a little bit of mouse drag action, so we are not done quite yet!
Part 4: Adding Masses with the Mouse
The idea here is that the user should be able to press down on the mouse button and draw a line by dragging it; the line will start where the user pressed down and end at the current position of the mouse cursor. When the user releases the mouse button, a new mass is spawned at the position of the screen where the user pressed down the mouse button, and the direction the mass will move is determined by the direction of the line; the length of the line determines the velocity vectors of the mass. So, how do we go about implementing this? Let us run through what we need to do, step by step. The code for steps one through six go above the animate method, while the code for step seven is a small addition to the animate method.
1. We need two variables that will store the x and y coordinates where the user pressed down the mouse button on the screen.
let mousePressX = 0;
let mousePressY = 0;
2. We need two variables that store the current x and y coordinates of the mouse cursor on the screen.
let currentMouseX = 0;
let currentMouseY = 0;
3. We need one variable that keeps track of whether the mouse is being dragged or not. The mouse is being dragged in the time that passes from when the user has pressed down the mouse button to the point where he releases it.
let dragging = false;
4. We need to attach a mousedown listener to the canvas element that logs the x and y coordinates of where the mouse was pressed down and sets the dragging variable to true.
6. We need to attach a mouseup listener to the canvas element that sets the drag variable to false, and pushes a new object representing a mass into the innerSolarSystem.masses array where the x and y position vectors are the point where the user pressed down the mouse button divided by value of the scale variable.
If we did not divide these vectors by the scale variable, the added masses would end up way out in the solar system, which is not what we want. The z position vector is set to zero and so is the z velocity vector. The x velocity vector is set to the x coordinate where the mouse was released subtracted by the x coordinate where the mouse was pressed down, and then you divide this number by 35. I will be honest and admit that 35 is a magical number that just happens to give you reasonable velocities when you add masses with the mouse to the inner solar system. Same procedure for the y velocity vector. The mass (m) of the mass we are adding is set by the user with a select element that we have populated with the masses of some famous celestial objects in the HTML markup. Last, but not least, we populate the object representing our mass with an instance of the Manifestation class so that the user can see it on the screen!
7. In the animate function, after the loop where we draw our manifestations and, before we call requestAnimationFrame, check if the mouse is being dragged. If that is the case, we’ll draw a line between the position where the mouse was pressed down and the mouse cursors current position.
const animate = () => {
  // Preceding code in the animate method down to and including the loop where we draw our mass manifestations

  if (dragging) {
    ctx.beginPath();
    ctx.moveTo(mousePressX, mousePressY);
    ctx.lineTo(currentMouseX, currentMouseY);
    ctx.strokeStyle = "red";
    ctx.stroke();
  }

  requestAnimationFrame(animate);
};
The inner solar system is about to get a lot more interesting — we can now add masses to our simulation!
Adding masses to our simulation with your mouse is not more difficult than that! Now, grab your mouse and unleash some mayhem on the inner solar system.
Part 5: Fencing off the Inner Solar System
As you will probably have noticed after adding some masses to the simulation, celestial objects are very shenanigan-prone in that they have a tendency to dance their way out of the viewport, especially if the added masses are very massive or they have too high of a velocity, which is kind of annoying. The natural solution to this problem is, of course, to fence off the inner solar system so that if a mass reaches the edge of the viewport, it will bounce back in! Sounds like quite a project, implementing this functionality, but fortunately doing so is a rather simple affair. At the end of the loop where we iterate over the masses and draw them in the animate method, we have insert two conditions: one that checks if our mass is outside the bounds of the viewport on the x-axis, and another that does the same check for the y axis. If the position of our mass is outside of the viewport on the x axis we reverse its x velocity vector so that it bounces back into the viewport, and the same logic applies if our mass is outside of the viewport on the y axis. With these two conditions, the animate method will look like so:
const animate = () => {
  // Advance the simulation by one step; clear the canvas

  for (let i = 0; i < massesLen; i++) {

    // Preceding loop code

    if (x < radius || x > width - radius) massI.vx = -massI.vx;

    if (y < radius || y > height - radius) massI.vy = -massI.vy;
  }

  requestAnimationFrame(animate);
};
Absolute madness! Venus, you silly planet, what are you doing out there?! You are supposed to be orbiting the Sun!
Ping, pong! It is almost as though we are playing a game of cosmic billiards with all those masses bouncing off the fence that we have built for the inner solar system!
Concluding Remarks
People have a tendency to think of orbital mechanics — which is what we have played around with in this tutorial — as something that is beyond the understanding of mere mortals such as yours truly. Truth, though, is that orbital mechanics follows a very simple and elegant set of rules, as this tutorial is a testament to. With a little bit of JavaScript and high-school mathematics and physics, we have reconstructed the inner solar system to a reasonable degree of accuracy, and gone beyond that to make things a little bit more spicy and, therefore, more interesting. With this simulator, you can answer silly what-if questions along the lines of, "What would happen if I flung a star with the mass of the Sun into our inner solar system?" or develop a feeling for Kepler's laws of planetary motion by, for example, observing the relationship between the distance of a mass from the Sun and its velocity.
I sure had fun writing this tutorial, and it is my sincere hope that you had as much fun reading it!
Today we’ll be exploring some ambient webpage background animations. The idea here was to create a collection of animations that are interesting to look at without being (too) distractive, and could be easily applied to the background of a webpage. Each animation is created using vanilla (es6+) JavaScript with the Canvas API, and 3 of 5 use Jonas Wagner’s Simplex Noise library.
There are a couple useful techniques I use in each demo to make things run more efficiently.
One is offscreen drawing or buffering. The idea is to have an in-memory canvas and context to handle all of the complex drawing, and an onscreen canvas to draw each new frame in the rendering loop. This technique also allows for re-drawing the same reference frame multiple times, which can be combined with filtering and compositing techniques to create some interesting effects.
Example:
  function render() {
    ctx.onscreen.drawImage(canvas.offscreen, 0, 0); // render offscreen canvas to onscreen
  }

  function draw() {
    ctx.offscreen.fillStyle = 'hsla(220,50%,50%,1)';
    ctx.offscreen.fillRect(0, 0, canvas.offscreen.width, canvas.offscreen.height); // fill offscreen canvas background

    // draw objects to offscreen canvas here

    render();
    window.requestAnimationFrame(draw);
  }
Another technique I use is to reduce all complex objects’ properties down into a single array.
For example, let’s say we want to draw a particle. A 2D particle tends to have the following basic properties:
position (x, y)
velocity (x, y)
color
Rather than storing these values as object properties, we can store them in a single typed array, thereby eliminating the need for a large array of complex particle objects.
Example:
  const particleCount = 200;
  const propCount = 5; // x, y, vx, vy, hue (hsla color)
  const propsLength = particleCount * propCount; // length of the props array

  let props;

  function createParticles() {
    props = new Float32Array(propCount);

    // iterate for the length of the props array
    // increment by the number of props per particle
    for (let i = 0; i < propsLength; i += propCount) {
      createParticle(i);
    }
  }

  function createParticle(i) {
    let x, y, vx, vy, hue;

    // initialize values here, can randomize, use simplex noise or anything really :)

    props.set([x, y, vx, vy, hue], i);
  }
Attention: Some of these techniques are very experimental and won’t work in all browsers.
Demo #1: Aurora
The first step in creating this effect was setting up the rays. The basic idea was to place them randomly along the x-axis and centered along the y-axis, then offset by the simplex noise field value at each position and draw as a gradient.
To achieve the blur effect, I initially draw everything to an offscreen canvas as mentioned above, then I copy and blur the image, then render in the onscreen canvas.
Demo #2: Swirl
To create this effect I use the simplex noise library to determine the noise value at each particle’s position at the current time in the animation. I then multiply that value by tau, or 2 * pi to get an angle in radians. I multiply that value by the number of noise steps, in this case 8, and apply that final value to the particles’ velocity. Multiplying by a number of steps creates the “banding” look in the particle movement.
To achieve the glow effect, I use the same blur technique as in the aurora demo, and then I re-draw the reference (offscreen) canvas without a blur and composite the frame with the current onscreen canvas.
Demo #3: Shift
For this effect, I create a number of large circles and place them randomly on the screen. I move them along at random and update their color values using the current noise value at their position and time. Then I blur and draw the reference frame to the onscreen canvas.
Demo #4: Coalesce
This effect uses the same technique for creating a glow effect as the swirl demo.
What I wanted to do here was to have each particle start out rushing for the center and then get caught in a spiral toward the center. To do this I store the direction value in my props array, then in my update loop I interpolate their direction from pointing directly at the center to pointing slightly off-center, also slowing the speed along the way.
To keep the squares from always facing the same direction, I used the .translate() and .rotate() functions to rotate each particle.
Demo #5: Pipeline
Although they may look like pipes, this is also a particle animation. Each particle is drawn only as a circle with a stroke, no fill and low opacity. They move along slowly and each previous frame is retained onscreen, which creates the look of pipes.
For the pipe turns, I setup an initial count for the number of possible turns, 8 for this animation. I get the value in radians of a single turn, and randomly decide for each pipe when to allow a turn and also decide if the turn should be negative or positive.