The State Of Mobile And Why Mobile Web Testing Matters

Things have changed quite a bit over the last decade when we just started exploring what we could do on a tiny, shiny mobile screen. These days, with mobile traffic accounting for over 50% of web traffic, it’s fair to assume that the very first encounter of your prospect customers with your brand will happen on a mobile device.

Depending on the nature of your product, the share of your mobile traffic will vary significantly, but you will certainly have some mobile traffic — and being prepared for it can make or break the deal. This requires your website or application to be heavily optimized for mobile. This optimization is quite complex in nature though. Obviously, our experiences will be responsive — and we’ve learned how to do so well over the years — but it also has to be accessible and fast.

This goes way beyond basic optimizations such as color contrast and server response times. In the fragmented mobile landscape, our experiences have to be adjusted for low data mode, low memory, battery and CPU, reduced motion, dark and light mode and so many other conditions.

Leaving these conditions out of the equation means abandoning prospect customers for good, and so we seek compromises to deliver a great experience within tight deadlines. And to ensure the quality of a product, we always need to test — on a number of devices, and in a number of conditions.

State Of Mobile 2021

While many of us, designers and developers, are likely to have a relatively new mobile phone in our pockets, a vast majority of our customers isn’t quite like us. That might come a little bit unexpected. After all, when we look at our analytics, we will hardly find any customers browsing our sites or apps with a mid-range device on a flaky 3G connection.

The gotcha here is that, if your mobile experience isn’t optimized for various devices and network conditions, these customers will never appear in your analytics — just because your website or app will be barely usable on their devices, and so they are unlikely to return.

In the US and the UK, Comscore’s Global State of Mobile 2020 report discovered in August 2020, that mobile usage accounted to 79% and 81% of total digital minutes respectively. Also, there was a 65% increase in video consumption on mobile devices in 2020. While a vast majority of the time is spent in just a few mobile apps, social media platforms provide a gateway to the web and your services — especially in education.

On the other hand, while devices do get better over time in terms of their capabilities and battery life, older devices don’t really get abandoned or disappear into the void. It’s not uncommon to see customers using devices that are 5-6 years old as these devices often get passed through the generations, serving as slightly older but "good enough" devices for simple, day-to-day tasks. In fact, an average consumer upgrades their phone every 2 years, and in the US phone replacement cycle is 33 months.

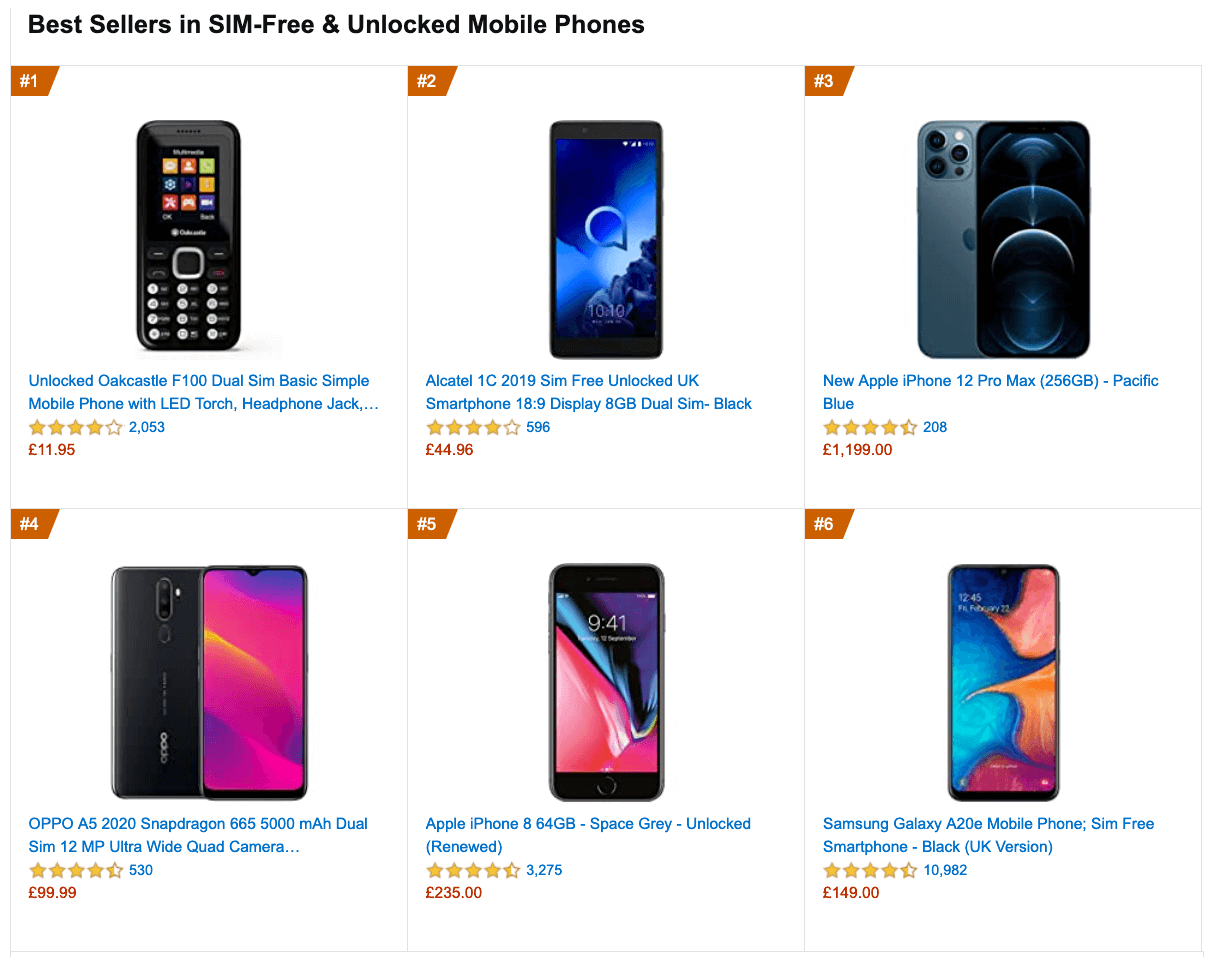
Globally in 2020, 84.8% of all shipped mobile phones are Android devices, according to the International Data Corporation (IDC). Average bestselling phones around the world cost just under $200. A representative device, then, is an Android device that is at least 24 months old, costing $200 or less, running on slow 3G, 400ms RTT and 400kbps transfer, just to be slightly more pessimistic.

This might be very different for your company, of course, but that’s a close enough approximation of a majority of customers out there. In fact, it might be a good idea to look into current Amazon Best Sellers for your target market.

Mobile is a spectrum, and a quite entrenched one. While the mobile landscape is very fragmented already, the gap between the experience on various devices will be widening much further with the growing adoption of 5G.

According to Ericsson Mobility Visualizer, we should be expecting a 15× increase in mobile 5G subscribers, from 212 million in 2020, to 3.3 billion by 2026.

If you’d like to dive deeper into the performance of Android and iOS devices, you can check Geekbench Android Benchmarks for Android smartphones and tablets, and iOS Benchmarks for iPhones and iPads.

It goes without saying that testing thoroughly on a variety of devices — rather just on a shiny new Android or iOS device — is critical for understanding and improving the experience of your prospect customers, and how well your website or app performs on a large scale.

Making A Case For Business

While it might sound valuable to test on mobile devices, it might not be convincing enough to drive the management and entire organization towards mobile testing. However, there are quite a few high-profile case studies exploring the impact of mobile optimization on key business metrics.

WPO stats collects literally hundreds of them — case studies and experiments demonstrating the impact of web performance optimization (WPO) across verticals and goals.

Driving Business Metrics

One of the famous examples is Flipkart, India’s largest e-commerce website. For a while, Flipkart adopted an app-only strategy and temporarily shut down its mobile website altogether. The company found it more and more difficult to provide a user experience that was as fast and engaging as that of their mobile app.

A few years ago, they’ve decided to unify their web presence and a native app into a mobile-optimized progressive web app, resulting in a 70% increase in conversion rate. They discovered that customers were spending three times more time on the mobile website, and the re-engagement rate increased by 40%.

Improving Search Engine Visibility

It’s not big news that search engines have been considering mobile friendliness as a part of search engine ranking. With Core Web Vitals, Google has been pushing the experience factors on mobile further to the forefront.

In his article on Core Web Vitals and SEO, Simon Hearne discovered that Google’s index update on 31st of May 2021 will result in a positive ranking signal for page experience in mobile search only, for groups of similar URLs, which meet all three Core Web Vital targets. The impact of the signal is expected to be small, similar to HTTPS ranking boost.

One thing is certain though: your websites will rank better if they are better optimized for mobile, both in terms of speed and mobile-friendliness — it goes for accessibility as well.

Improving Accessibility

Building accessible pages and applications isn’t easy. The challenges start with tiny hit targets, poor contrast and small font size, but it quickly gets much more complicated when we deal with complex single-page-applications. To ensure that we cater well for our customers in various situations — with permanent, temporary and situational disabilities — we need to test for accessibility.

That means considering keyboard navigation, how navigation landmarks are properly assigned, how updates are announced by a screen reader, and whether we avoid any inaccessible libraries or third-party scripts. And then, for every component we are building, we need to ensure that we keep them accessible over time.

It shouldn’t be surprising that if a website isn’t accessible to a customer, they are unlikely to access your product either. The earlier you invest in accessibility testing, the more you’ll save down the road on expensive consultancy, expensive third-party services, or expensive lawyers.

Mobile Web Testing

So, with all the challenges in the mobile space, how, then, do we test on mobile? Fortunately, there is no shortage of mobile testing tools out there. However, most times, when performing mobile testing, the focus is mostly on consistency and functionality but for a more thorough mobile test, we need to go a layer deeper into some not-so-obvious specifics of testing.

Screen sizes

Screen sizes are one of the many things that are always changing in the realm of mobile devices. Year after year new screen sizes and pixel densities appear with new device releases. This poses a problem in testing websites and apps on these devices, making debugging more difficult and time-consuming.

OS Version fragmentation

With iOS having a high adoption rate on its latest OS releases (a rate of 57% on its latest iOS 14), and the plethora of versions still being used by Android devices going as far back as Ice Cream Sandwich, one must make sure to account to this fragmentation when doing mobile testing.

Browser fragmentation

With Chrome and Safari having a global usage of 62.63% and 24.55% on mobile respectively, one might be tempted to focus on just these browsers when performing mobile tests. However, depending on the region of the world, you are more likely to test in other, less-known browsers, or proxy browsers, such as Opera Mini. Even though their percentage usage might be small, it might run into hundreds of thousands of usage globally.

Performing Mobile Web Testing

To perform mobile web testing, one option is to set up a device lab, and run tests locally. In times of remote work, it’s quite challenging as you usually need a number of devices at your disposal. Acquiring these devices doesn’t have to be expensive, and experiencing the loading on your own is extremely valuable. However, if we want to check how consistent the experience is, or conduct automated tests, it’s probably not going to be enough.

In such cases, a good starting point is Responsively, a free open-source tool with mirrored interactions, customizable layout, 30+ built-in device profiles, hot reloading and screenshot tools.

Also, you might want to look into dedicated developer-focused browsers for mobile testing as well.

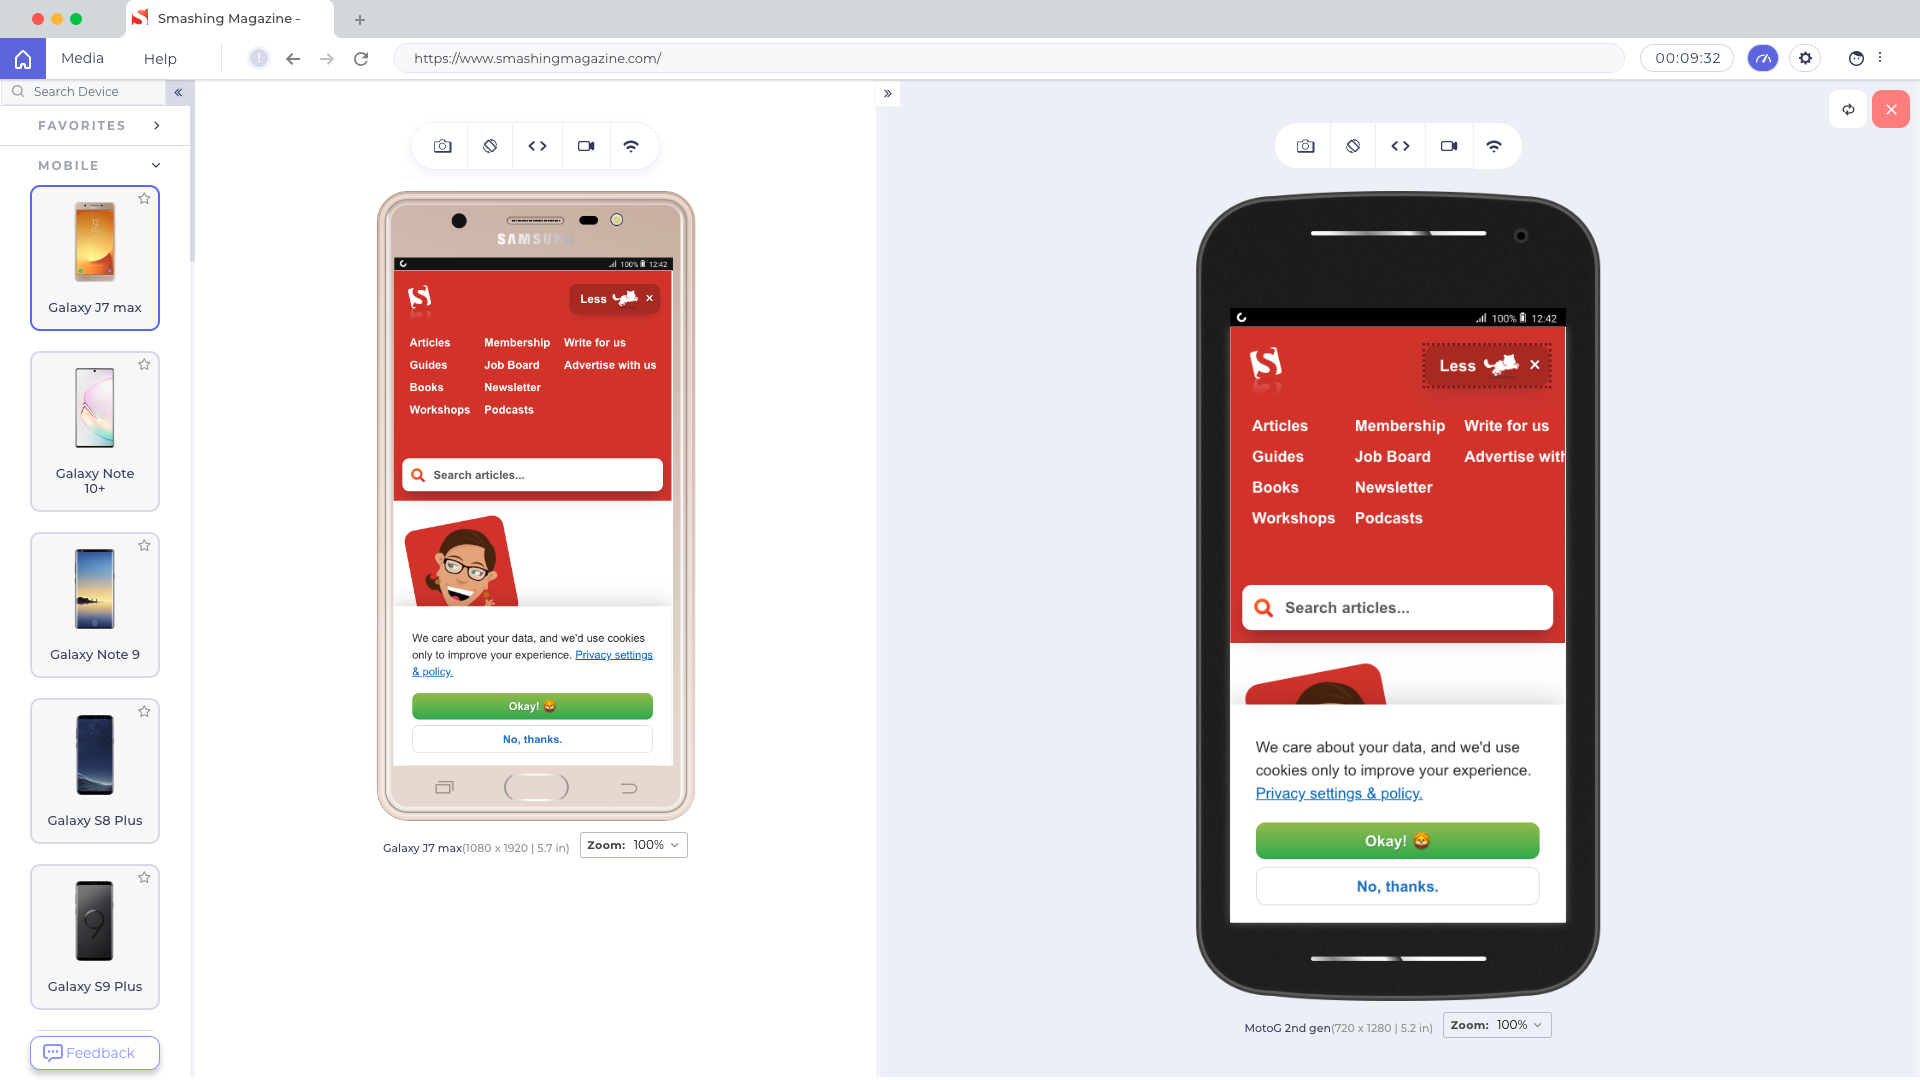
Sizzy supports sync scrolling, clicking and navigation across devices, as well as takes screenshots of all devices at once, with and without a device frame. Plus, it includes a Universal Inspect Element to inspect all devices at once.

Blisk supports over 50 devices out of the box, along with sync scrolling. You can test touch support and preview devices side-by-side, working with the same piece of code across all opened devices. Hot-reloading is supported as well, as well as video recording and screenshots.

Another little helpful tool is LT Browser, a web application allowing you to perform mobile view debugging on 45+ devices — on mobile, tablet and desktop. (Full disclosure and reminder: LambdaTest is a friendly sponsor of this article).

Once you have downloaded the browser and registered, you can build, test, and debug your website, as well as take screenshots and videos of bugs, assign them to specific devices, run a performance profiling and observe multiple devices side by side. By default, a free version provides 30 mins per day.

If you need something slightly more advanced, LambdaTest allows you to run a cross-browser test on 2000+ devices on different operating systems. Also, BrowserStack provides an option to automate testing as well as testing for low battery, abrupt power off, and interruptions such as calls or SMS.

Conclusion

In this article, we have looked into the state of mobile in 2021. We’ve seen the growing usage of mobile devices as the primary means to access the web, and we’ve looked into some challenges related to that. We’ve also looked into some specific challenges around mobile testing, and how some tools can help us find and fix bugs on mobile.

Keep in mind that your website is the face of your business and more and more users are going to access it via their mobile phones. It’s important to make sure that your users can access the services you provide on your website and have an accessible and fast experience on their devices as they do on the desktop version. This will ensure that the benefits of brand visibility get the attention they deserve.

Getting Started With The GetX Package In Flutter Applications

Flutter is one of the fastest ways to build truly cross-platform native applications. It provides features allowing the developer to build a truly beautiful UI experience for their users.

However, most times to achieve things like navigating to screens, state management, and show alerts, a lot of boilerplates are needed. These boilerplates tend to slow down the development efficiency of developers trying to go about building features and meeting their deadlines.

Take for example the boilerplate needed to navigate to a screen in a Flutter application. Let’s say you want to navigate to a screen called AboutScreen. you will have to write:

Navigator.push(
    context,
    MaterialPageRoute(builder: (context) => AboutScreen()),
  );

It would be more efficient and developer-friendly to do something like:

Get.to(AboutScreen());

When you need to navigate back to the previous page in Flutter you will have to write:

Navigator.pop(context);

You will notice we are always depending on context property for something as commonplace as navigating between screens. What if instead, we can do something like this:

Get.back();

The above examples are some of the ways where application development in Flutter can be improved to be more intuitive and efficient with less boilerplate. If you favor simplicity and being efficient in building out features and ideas, in Flutter then the Get package will interest you.

What Is GetX

Get or GetX is a fast, stable, extra-light framework for building Flutter applications.

GetX ships out of the box with high-performance state management, intelligent dependency injection, and route management in a simplistic and practical way.

GetX aims to minimize boilerplates while also providing simple and intuitive syntax for developers to use while building their applications. At the core of GetX are these 3 principles:

  • Performance
    GetX focuses on the performance of your application by implementing its features to consume as little resources as possible.
  • Productivity
    GetX wants developers to use its features to be productive as quickly as possible. It does so by employing easy to remember syntax and practices. For example, generally, the developer should be concerned to remove controllers from memory but GetX out of the box provides smart management that monitors controllers in your application and remove them when they are not being used by default.
  • Organization
    GetX allows the decoupling of the View, presentation logic, business logic, dependency injection, and navigation in your Flutter application. You do not need context to navigate between routes, so you are not dependent on the widget tree for navigation. You don’t need context to access your controllers/blocs through an inheritedWidget, so you can completely decouple your presentation logic and business logic from your view layer. You do not need to inject your Controllers/Models/Blocs classes into your widget tree through multiproviders, for this GetX uses its own dependency injection feature, decoupling the DI from its view completely.

Features Of GetX

GetX comes with a couple of features you will need in your daily app development in Flutter. Let’s look at them:

State Management

One of the flagship features of GetX is its intuitive state management feature. State management in GetX can be achieved with little or no boilerplate.

Route Management

GetX provides API for navigating within the Flutter application. This API is simple and with less code needed.

Dependency Management

GetX provides a smart way to manage dependencies in your Flutter application like the view controllers. GetX will remove any controller not being used at the moment from memory. This was a task you as the developer will have to do manually but GetX does that for you automatically out of the box.

Internationalization

GetX provides i18n out of the box allowing you to write applications with various language support.

Validation

GetX provides validation methods for performing input validation in your Flutter applications. This is quite convenient as you wouldn’t need to install a separate validation package.

Storage

GetX provides a fast, extra light, and synchronous key-value in memory, which backs up data to disk at each operation. It is written entirely in Dart and easily integrates with the core GetX package.

Getting Started With GetX

Now that you have seen what GetX is and the features and benefits it provides, let’s see how to set it up in your application. We will build a demo app to see most of the features we have mentioned in action. Let’s get started.

Create A Brand New Flutter Application

We will get started by creating a brand new Flutter application through the Flutter CLI. I am assuming your machine is already set up for application development with Flutter. So we run:

flutter create getx_demo

This will generate the basic code needed for a Flutter application. Next, open up the project you just created in your editor of choice (We will be using VS Code for this article). We will then run the project to make sure it’s working alright (Make sure you have either a device connected or an emulator/simulator running).

When the application runs, you will see the default counter application that Flutter scaffold for you when you create a new Flutter application. What we are going to do is to implement the very same counter application but with GetX to manage the state of the app (which is the count variable).

We will start with clearing main.dart and leaving only this snippet of code:

# main.dart
import 'package:flutter/material.dart';

void main() {
  runApp(MyApp());
}

class MyApp extends StatelessWidget {
  // This widget is the root of your application.
  @override
  Widget build(BuildContext context) {
    return MaterialApp(
      title: 'Flutter Demo',
      theme: ThemeData(
        primarySwatch: Colors.blue,
        visualDensity: VisualDensity.adaptivePlatformDensity,
      ),
      home: MyHomePage(title: 'Flutter Demo Home Page'),
    );
  }
}

By now our application would have been broken since there is no MyHomePage widget anymore. Let’s fix that. With GetX, we don’t need stateful widgets and also our UI can be clearly separated from our business logic. So we will create two directories inside lib/. These directories are:

views/ To hold the screens in our application.
controllers/ To hold all controllers for the screens in our application.

Let’s create MyHomePage widget inside views/. The name of the file will be my_home_page.dart. After you create it, add the following code snippet to it:

import 'package:flutter/material.dart';

class MyHomePage extends StatelessWidget {
  final String title;

  MyHomePage({this.title});
  @override
  Widget build(BuildContext context) {
    return Scaffold(
      appBar: AppBar(
        title: Text(title),
      ),
      body: Center(
        child: Column(
          mainAxisAlignment: MainAxisAlignment.center,
          children: <Widget>[
            Text(
              'You have pushed the button this many times:',
            ),
            Text(
              '0',
              style: Theme.of(context).textTheme.headline4,
            ),
          ],
        ),
      ),
      floatingActionButton: FloatingActionButton(
        onPressed: null,
        tooltip: 'Increment',
        child: Icon(Icons.add),
      ),
    );
  }
}

Now we have the MyHomePage widget, let’s import it in main.dart. Add the import statement to the top of main.dart below import 'package:flutter/material.dart';

import './views/my_home_page.dart';

Now your main.dart file should look like this:

import 'package:flutter/material.dart';
import './views/my_home_page.dart';

void main() {
  runApp(MyApp());
}

class MyApp extends StatelessWidget {
  // This widget is the root of your application.
  @override
  Widget build(BuildContext context) {
    return MaterialApp(
      title: 'Flutter Demo',
      theme: ThemeData(
        primarySwatch: Colors.blue,
        visualDensity: VisualDensity.adaptivePlatformDensity,
      ),
      home: MyHomePage(title: 'Flutter Demo Home Page'),
    );
  }
}

When you save your application now, all errors should have been fixed and the app will run. But you will notice when you click the button again, the counter won’t be updated. If you look at the views/my_home_page.dart code, you will see we are just hard coding 0 as the value of the Text widget and passing null to the onPressed handler of the button. Let’s bring in GetX to the mix to get the application functional again.

Installing GetX

Head over to the install page for GetX on pub.dev and you will see the line of code to copy to place in your pubspec.yml file to install GetX. As of the time of writing this article, the current version of GetX is 3.23.1. So we will copy the line:

get: ^3.23.1

And then paste it under the dependencies section of our pubspec.yml file. When you save the file, get should be automatically installed for you. Or you can run manually in your terminal.

flutter pub get

The dependencies section of your pubspec.yml file should look like this:

dependencies:
  flutter:
    sdk: flutter
  get: ^3.23.1

GetxController

We have mentioned that GetX allows you to separate the UI of your application from the logic. It does this by providing a GetxController class which you can inherit to create controller classes for the views of your application. For our current app, we have one view so we will create a controller for that view. Head over to the controllers/ directory and create a file called my_home_page_controller.dart. This will hold the controller for the MyHomePage view.

After you’ve created the file, first import the GetX package by adding this to the top of the file:

import 'package:get/get.dart';

Then you will create a class called MyHomePageController inside it and extend the GetxController class. This is how the file should look like:

import 'package:get/get.dart';

class MyHomePageController extends GetxController {}

let’s add the count state to the class we’ve created.

final count = 0;

In GetX, to make a variable observable — this means that when it changes, other parts of our application depending on it will be notified. To do this we simply need to add .obs to the variable initialization. So for our above count variable, we will add .obs to 0. So the above declaration will now look like this:

final count = 0.obs;

This is how our controller file looks like at the moment:

import 'package:get/get.dart';

class MyHomePageController extends GetxController {
  final count = 0.obs;
}

To wrap things up with the MyHomePageController we will implement the increment method. This is the snippet to do that:

increment() => count.value++;

You will notice we needed to add .value to the count variable to increment it. We did this because adding .obs to a variable makes it an observable variable and to get the value of an observable variable, you do so from the value property.

So we are done with the controller. Now when the value of count changes, any part of our application using it will be updated automatically.

We will now head over to our view and let it know about the controller we just created. We will do so by instantiating the controller class using GetX dependency management feature. This will ensure that our controller won’t be in memory when it is no longer needed.

In views/my_home_page.dart import the Get package and also the controller you created like so:

import 'package:get/get.dart';
import '../controllers/my_home_page_controller.dart';

Then inside the MyHomePage class we will instantiate the MyHomePageController:

final MyHomePageController controller = Get.put(MyHomePageController());

Now we have an instance of the MyHomePageController, we can use the state variable as well as the method. So starting with the state, in GetX to mark a part of your UI to be rebuilt when a state variable changes, you will wrap that part with the Obx widget. GetX provides other ways of doing this, but this method is much simpler and cleaner.

For our count application we want the Text widget to be updated with the current count. So we will wrap the Text widget with Obx widget like so:

Obx(() => Text('0',style: Theme.of(context).textTheme.headline4,),)

Next, we will replace the static string 0 with the count variable from the MyHomePageController like so:

Obx(() => Text('${controller.count.value}',
,style: Theme.of(context).textTheme.headline4,),)

Lastly, we will call the increment method when the floatingActionButton is pressed like so:

floatingActionButton: FloatingActionButton(
        onPressed: controller.increment,
        tooltip: 'Increment',
        child: Icon(Icons.add),
      ),

So overall, our MyHomePage view file should now look like this:

import 'package:flutter/material.dart';
import 'package:get/get.dart';
import '../controllers/my_home_page_controller.dart';

class MyHomePage extends StatelessWidget {
  final String title;
  final MyHomePageController controller = Get.put(MyHomePageController());
  MyHomePage({this.title});
  @override
  Widget build(BuildContext context) {
    return Scaffold(
      appBar: AppBar(
        title: Text(title),
      ),
      body: Center(
        child: Column(
          mainAxisAlignment: MainAxisAlignment.center,
          children: <Widget>[
            Text(
              'You have pushed the button this many times:',
            ),
            Obx(
              () => Text(
                '${controller.count.value}',
                style: Theme.of(context).textTheme.headline4,
              ),
            )
          ],
        ),
      ),
      floatingActionButton: FloatingActionButton(
        onPressed: controller.increment,
        tooltip: 'Increment',
        child: Icon(Icons.add),
      ),
    );
  }
}

When you save your application or you rerun it, the counter app should be working as it did when we first created the application.

I believe you have seen how intuitive state management is with GetX, we didn’t have to write a lot of boilerplate and this simplicity will be more obvious as your application get complex. You will also notice our view doesn’t hold or maintain any state so it can be a stateless widget. The brain of the view in turn is now a controller class that will hold the state for the view and methods.

Navigation In GetX

We have seen state management in GetX. Let’s now look at how GetX supports Navigation within your application. To activate the Navigation feature of GetX, you only need to make one change in main.dart which is to turn the MaterialApp widget to a GetMaterialApp widget. Let’s do that by first importing Get in the top of main.dart

import 'package:get/get.dart';

Then we make the change to MaterialApp so our main.dart file now look like this:

import 'package:flutter/material.dart';
import 'package:get/get.dart';
import './views/my_home_page.dart';

void main() {
  runApp(MyApp());
}

class MyApp extends StatelessWidget {
  // This widget is the root of your application.
  @override
  Widget build(BuildContext context) {
    return GetMaterialApp(
      title: 'Flutter Demo',
      theme: ThemeData(
        primarySwatch: Colors.blue,
        visualDensity: VisualDensity.adaptivePlatformDensity,
      ),
      home: MyHomePage(title: 'Flutter Demo Home Page'),
    );
  }
}

Now our app has been set up to support GetX navigation. To test this out we will create another view in views/ directory. We will call this on about_page.dart and it will contain the following code:

import 'package:flutter/material.dart';
import 'package:get/get.dart';
import '../controllers/my_home_page_controller.dart';

class AboutPage extends StatelessWidget {
  final MyHomePageController controller = Get.put(MyHomePageController());
  @override
  Widget build(BuildContext context) {
    return Scaffold(
      appBar: AppBar(
        title: Text('About GetX'),
      ),
      body: Center(
        child: Column(
          mainAxisAlignment: MainAxisAlignment.center,
          children: <Widget>[
            Padding(
              padding: const EdgeInsets.all(16.0),
              child: Text(
                'GetX is an extra-light and powerful solution for Flutter. It combines high performance state management, intelligent dependency injection, and route management in a quick and practical way.',
              ),
            ),
          ],
        ),
      ),
    );
  }
}

We will then go over to MyHomePage and add a button that when pressed will navigate us to the AboutPage. Like so. The button should be below the Obx widget. Here it is:

 FlatButton(onPressed: () {}, child: Text('About GetX'))

We will also need to import the AboutPage on top of the MyHomePage file:

import './about_page.dart';

To tell GetX to navigate to the AboutPage all we need is one line of code which is:

Get.to(AboutPage());

Let’s add that to the onPressed callback of the FlatButton widget like so:

 FlatButton(

    onPressed: () {
       Get.to(AboutPage());
              },
  child: Text('About GetX'))

When you save your application now, you will now be able to navigate to the AboutPage.

You can also choose to replace the MyHomePage view with the AboutPage so the user won’t be able to navigate back to the previous page by hitting the device back button. This is useful for screens like login screens. To do this, replace the content of the onPressed handler with the below code:

  Get.off(AboutPage());

This will pop the MyHomePage view and replace it with AboutPage.

Now that we can navigate to the AboutPage, I think it won’t be so bad to be able to go back to MyHomePage to do this we will add a button in AboutPage after the Padding widget and in it’s onPressed handler we will make a call to Get.back() to navigate back to the MyHomePage:

 FlatButton(
    onPressed: () {
        Get.back();
    },
    child: Text('Go Home')
)

Snackbar

In Flutter conventionally to show a Snackbar, you will need to write something like this:

final snackBar = SnackBar(content: Text('Yay! A SnackBar!'));
// Find the Scaffold in the widget tree and use it to show a SnackBar.
Scaffold.of(context).showSnackBar(snackBar);

You can observe we are still depending on the context property. Let’s see how we can achieve this in GetX. Go into the MyHomePage view and add another FlatButton widget below the last button we added. Here is the snippet for the button:

 FlatButton(
      onPressed: () {
         // TODO: Implement Snackbar
       },
      child: Text('Show Snackbar'))

Let’s display the message ‘Yay! Awesome GetX Snackbar’. Inside the onPressed handler function add the below line of code:

 Get.snackbar('GetX Snackbar', 'Yay! Awesome GetX Snackbar');

Run your application and when you click on the “Show Snackbar button” you will see a snackbar on top of your application!

See how we reduced the number of lines needed to show a snackbar in a Flutter application? Let’s do some more customization on the Snackbar; Let’s make it appear at the bottom of the app. Change the code to this:

Get.snackbar('GetX Snackbar', 'Yay! Awesome GetX Snackbar',snackPosition:SnackPosition.BOTTOM,
);

Save and run your application and the Snackbar will now appear at the bottom of the application. How about we change the background color of the Snackbar as it is at the moment transparent. We will change it to an amberAccent color from the Colors class in Flutter. Update the code to this:

Get.snackbar('GetX Snackbar', 'Yay! Awesome GetX Snackbar',snackPosition:SnackPosition.BOTTOM, backgroundColor: Colors.amberAccent
);

Overall, the button code should look like this:

 FlatButton(
                onPressed: () {
                  Get.snackbar('GetX Snackbar', 'Yay! Awesome GetX Snackbar',
                      snackPosition: SnackPosition.BOTTOM,
                      backgroundColor: Colors.amberAccent);
                },
                child: Text('Show Snackbar'))

Dialog

GetX provides a simple method for creating AlertDialog in Flutter. Let’s see it in action. Create another button below the previous one:

 FlatButton(
                onPressed: () {
                 // TODO: Show alert dialog
                },
                child: Text('Show AlertDialog'))

Let’s call GetX to display an alert Dialog:

Get.defaultDialog();

That will show a default Alert Dialog that is dismissable by tapping outside the Dialog. You can see how in one line of code we have a working alert dialog. Let’s customize it a bit. Let’s change the title and the message:

 Get.defaultDialog(
                      title: 'GetX Alert', middleText: 'Simple GetX alert');

Save and run your app and you will see the changes when you hit the “Show AlertDialog” button. We can add confirm and Cancel buttons like so:

Get.defaultDialog(
                      title: 'GetX Alert',
                      middleText: 'Simple GetX alert',
                      textConfirm: 'Okay',
                      confirmTextColor: Colors.amberAccent,
                      textCancel: 'Cancel');

There are a lot of ways to customize the GetX dialog and the API is quite intuitive and simple.

Conclusion

GetX was created to improve the productivity of Flutter developers as they build out features. Instead of having to search for boilerplate needed to do things like state management, navigation management, and more, GetX provides a simple intuitive API to achieve these activities without sacrificing performance. This article introduces you to GetX and how to get started using it in your Flutter applications.

Testing Vue Applications With The Vue Testing Library

In this article, we will look at testing Vue applications using the Vue Testing Library — a lightweight library that emphasizes testing your front-end application from the user’s perspective.

The following assumptions are made throughout this article:

  • The reader is familiar with Vue.
  • The reader is familiar with testing application UI.

Conventionally, in Vue userland, when you want to test your application, you reach out for @vue/test-utils — the official testing library for Vue. @vue/test-utils provides APIs to test instances of rendered Vue components. Like so:

// example.spec.js
import { shallowMount } from '@vue/test-utils'
import HelloWorld from '@/components/HelloWorld.vue'

describe('HelloWorld.vue', () => {
  it('renders props.msg when passed', () => {
    const msg = 'new message'
    const wrapper = shallowMount(HelloWorld, {
      propsData: { msg }
    })
    expect(wrapper.text()).toMatch(msg)
  })
})

You can see we are mounting an instance of the Vue component using the shallowMount function provided by @vue/test-utils.

The problem with the above approach to testing Vue applications is that the end-user will be interacting with the DOM and has no knowledge of how Vue renders the UI. Instead, he/she will be finding UI elements by text content, the label of the input element, and some other visual cues on the page.

A better approach will be writing tests for your Vue applications in such a way that mirrors how an actual user will interact with it e.g looking for a button to increment the quantity of a product in a checkout page, hence Vue Testing Library.

What Is Vue Testing Library?

Vue Testing Library is a lightweight testing library for Vue that provides lightweight utility functions on top of @vue/test-utils. It was created with a simple guiding principle:

The more your tests resemble the way your software is used, the more confidence they can give you.
testing-library.com

Why Use Vue Testing Library

  • You want to write tests that are not focused on implementation details i.e testing how the solution is implemented rather than if it produces the desired output.

  • You want to write tests that focus on the actual DOM nodes and not rendered Vue components.

  • You want to write tests that query the DOM in the same way a user would.

How Vue Testing Library Works

Vue Testing Library functions by providing utilities for querying the DOM in the same way a user would interact with the DOM. These utilities allow you to find elements by their label text, find links and buttons from their text content and assert that your Vue application is fully accessible.

For cases where it doesn't make sense or is not practical to find elements by their text content or label, Vue testing Library provides a recommended way to find these elements by using data-testid attribute as an escape hatch for finding these elements.

The data-testid attribute is added to the HTML element you plan on querying for in your test. E.g

<button data-testid="checkoutButton">Check Out</button>

Getting Started With Vue Testing Library

Now that you have seen why you should use Vue Testing Library and how it works, let's proceed by setting it up in a brand new Vue CLI generated Vue project.

First, we will generate a new Vue application by running the below command in the terminal (assuming you have Vue CLI installed on your machine):

vue create vue-testing-library-demo

To run our tests, we will be using Jest — a test runner developed by Facebook. Vue CLI has a plugin that easily sets up Jest. Let's add that plugin:

vue add unit-jest

You will notice the plugin added a new script in package.json:

 "test:unit": "vue-cli-service test:unit",

This would be used to run the tests. It also added a new tests folder in src and inside the tests folder a unit folder with an example test file called example.spec.js. Based on the configuration of Jest, when we run npm run test:unit Jest will look for files in tests directory and run the test files. Let's run the example test file:

npm run test:unit

This should run the example.spec.js test file in tests/unit directory. Let's look at the content of this file:

import { shallowMount } from '@vue/test-utils'
import HelloWorld from '@/components/HelloWorld.vue'

describe('HelloWorld.vue', () => {
  it('renders props.msg when passed', () => {
    const msg = 'new message'
    const wrapper = shallowMount(HelloWorld, {
      propsData: { msg }
    })
    expect(wrapper.text()).toMatch(msg)
  })
})

By default, installing Jest with the Vue CLI plugin will install @vue/test-utils, hence the above test file is using the shallowMount function from @vue/test-utils. A quick way to get familiar with Vue Testing Library is to quickly modify this same test file to use Vue Testing Library instead of @vue/test-utils.

We would do this by first uninstalling @vue/test-utils as we won't be needing it.

npm uninstall @vue/test-utils --save-dev

Then we install Vue Testing Library as a development dependency:

npm install @testing-library/vue --save-dev

Then we proceed to modify tests/unit/example.spec.js to this:

import { render } from '@testing-library/vue'
import HelloWorld from '@/components/HelloWorld.vue'

describe('HelloWorld.vue', () => {
  it('renders props.msg when passed', () => {
    const msg = 'new message'
    const { getByText } = render(HelloWorld, {
      props: { msg }
    })
    getByText(msg)
  })
})

Run the test again and it should still pass. Let's look at what we did:

  • We use the render function exposed by Vue Testing Library to render the HelloWorld components. render is the only way of rendering components in Vue Testing Library. When you call render, you pass in the Vue component and an optional options object.

  • We then use the options object to pass in the msg props needed by the HelloWorld component. render will return an object with helper methods to query the DOM and one of those methods is getByText.

  • We then use getByText to assert if an element with the text content of 'new message' exist in the DOM.

By now you might have noticed the shift from thinking about testing the rendered Vue component to what the user sees in the DOM. This shift will allow you test your applications from the user perspective as opposed to focusing more on the implementation details.

Our Demo App

Now that we have established how testing is done in Vue using Vue Testing Library, we will proceed to test our demo application. But first, we will flesh out the UI for the app. Our demo app is a simple checkout page for a product. We will be testing if the user can increment the quantity of the product before checkout, he/she can see the product name and price, and so on. Let’s get started.

First, create a new Vue component called checkout in components/ directory and add the snippet below to it:

<template>
    <div class="checkout">
        <h1>{{ product.name }} - <span data-testid="finalPrice">${{ product.price }}</span></h1>
        <div class="quantity-wrapper">
            <div>
                <label for="quanity">Quantity</label>
                <input type="number" v-model="quantity" name="quantity" class="quantity-input" />
            </div>
           <div>
                <button @click="incrementQuantity" class="quantity-btn">+</button>
                <button @click="decrementQuantity" class="quantity-btn">-</button>
           </div>
        </div>
          <p>final price - $<span data-testId="finalPrice">{{ finalPrice }}</span></p>
        <button @click="checkout" class="checkout-btn">Checkout</button>
    </div>
</template>
<script>
export default {
    data() {
        return {
            quantity: 1,
        }
    },
    props: {
    product: {
        required: true
        }
    },
    computed: {
        finalPrice() {
            return this.product.price * this.quantity
        }
    },
    methods: {
        incrementQuantity() {
            this.quantity++;
        },
        decrementQuantity() {
            if (this.quantity == 1) return;
            this.quantity--;
        },
        checkout() {

        }
    }
}
</script>

<style scoped>
.quantity-wrapper {
    margin: 2em auto;
    width: 50%;
    display: flex;
    justify-content: center;
}

.quantity-wrapper div {
    margin-right: 2em;
}
.quantity-input {
    margin-left: 0.5em;
}
.quantity-wrapper button {
    margin-right: 1em;
}
button {
    cursor: pointer;
}
</style>

Then modify App.vue to:

<template>
  <div id="app">
    <check-out :product="product" />
  </div>
</template>

<script>
import CheckOut from './components/CheckOut.vue'

export default {
  name: 'App',
  data() {
     return {
          product: {
          name: 'Shure Mic SM7B',
          price: 200,
      }
    }
  },
  components: {
    CheckOut
  }
}
</script>

<style>
#app {
  font-family: Avenir, Helvetica, Arial, sans-serif;
  -webkit-font-smoothing: antialiased;
  -moz-osx-font-smoothing: grayscale;
  text-align: center;
  color: #2c3e50;
  margin-top: 60px;
}
</style>

For our test case we will be testing the following scenarios:

  1. Can the user see the product name?
  2. Can the user see the product price?
  3. Can the user increment product quantity?
  4. Can the user decrement product quantity?
  5. Can the user see the updated total price in real-time as the quantity changes?

Our UI is pretty minimalistic as the emphasis is on testing with Vue Testing Library. Let's proceed to test the Checkout component. Create a new test file in tests/unit/ called checkout.spec.js.

We will then proceed to scaffold the test file:

import { render, fireEvent } from '@testing-library/vue'
import CheckOut from '@/components/CheckOut.vue'

const product = {
    name: 'Korg Kronos',
    price: 1200
}
describe('Checkout.vue', () => {
  // tests goes here
})

Our very first test case will be to check if the product name is rendered. We would do so like so:

 it('renders product name', () => {
        const { getByText } = render(CheckOut, {
            props: { product }
        })

        getByText(product.name)
 })

Then we will check if the product price is rendered:

it('renders product price', () => {
        const { getByText } = render(CheckOut, {
            props: { product }
        })

        getByText("$" + product.price)
 })

Going forward with testing the Checkout component, we will test if the initial quantity the user sees is 1 using the getByDisplayValue helper method:

it('renders initial quantity as 1', () => {
        const { getByDisplayValue, getByText } = render(CheckOut, {
            props: { product }
        })
        getByDisplayValue(1)
    })

Next up, we will be checking if when the user clicks the button to increment product quantity, the quantity is incremented. We will do this by firing the click event using the fireEvent utility from Vue Testing Library. Here is the complete implementation:

it('increments product quantity', async () => {
        const { getByDisplayValue, getByText } = render(CheckOut, {
            props: { product }
        })
        const incrementQuantityButton = getByText('+')
        await fireEvent.click(incrementQuantityButton)
        getByDisplayValue(2)
})

We will do the same for decrement when the quantity is 1 — in this case, we don't decrement the quantity. And also when the quantity is 2. Let's write both test cases.

it('does not decrement quantity when quanty is 1', async () => {
        const { getByDisplayValue, getByText } = render(CheckOut, {
            props: { product }
        })
        const decrementQuantityButton = getByText('-')
        await fireEvent.click(decrementQuantityButton)
        getByDisplayValue(1)
    })

 it('decrement quantity when quantity greater than 1', async () => {
        const { getByDisplayValue, getByText } = render(CheckOut, {
            props: { product }
        })
        const incrementQuantityButton = getByText('+')
        const decrementQuantityButton = getByText('-')
        await fireEvent.click(incrementQuantityButton)
        await fireEvent.click(decrementQuantityButton)
        getByDisplayValue(1)
    })

Lastly, we will test if the final price is being calculated accordingly and displayed to the user when both the increment and decrement quantity buttons are clicked.

it('displays correct final price when increment button is clicked', async () => {
        const {  getByText, getByTestId } = render(CheckOut, {
            props: { product }
        })
        const incrementQuantityButton = getByText('+')
        await fireEvent.click(incrementQuantityButton)
        getByText(product.price * 2)
    })

it('displays correct final price when decrement button is clicked', async () => {
        const {  getByText} = render(CheckOut, {
            props: { product }
        })
        const incrementQuantityButton = getByText('+')
        const decrementQuantityButton = getByText('-')
        await fireEvent.click(incrementQuantityButton)
        await fireEvent.click(decrementQuantityButton)
        getByText(product.price)
    })

All throughout our test cases, you will notice that we were more focused on writing our tests from the perspective of what the user will see and interact with. Writing tests this way ensures that we are testing what matters to the users of the application.

Conclusion

This article introduces an alternative library and approach for testing Vue applications called Vue Testing Library, we see how to set it up and write tests for Vue components with it.

Resources

You can find the demo project on GitHub.

Supercharge Testing React Applications With Wallaby.js

One thing you will discover very quickly when you start writing tests for an application is that you want to run your tests constantly when you are coding. Having to switch between your code editor and terminal window (or in the case of VS Code, the integrated terminal) adds an overhead and reduces your productivity as you build your application. In an ideal world, you would have instant feedback on your tests right in your editor as you are writing your code. Enter Wallaby.js.

What Is Wallaby.js?

Wallaby.js is an intelligent test runner for JavaScript that continuously runs your tests. It reports code coverage and other results directly to your code editor immediately as you change your code (even without saving the file). The tool is available as an editor extension for VS Code, IntelliJ Editors (such as WebStorm and IntelliJ IDEA), Atom, Sublime Text, and Visual Studio.

Why Wallaby.js?

As stated earlier, Wallaby.js aims to improve your productivity in your day to day JavaScript development. Depending on your development workflow, Wallaby can save you hours of time each week by reducing context switching. Wallaby also provides code coverage reporting, error reporting, and other time-saving features such as time-travel debugging and test stories.

Getting Started With Wallaby.js In VS Code

Let’s see how we can get the benefits of Wallaby.js using VS Code.

Note: If you are not using VS Code you can check out here for instructions on how to set up for other editors.

Install The Wallaby.js VS Code Extension

To get started we will install the Wallaby.js VS Code extension.

After the extension is installed, the Wallaby.js core runtime will be automatically downloaded and installed.

Wallaby License

Wallaby provides an Open Source license for open source projects seeking to use Wallaby.js. Visit here to obtain an open-source license. You may use the open-source license with the demo repo for this article.

You can also get a fully functional 15-day trial license by visiting here.

If you want to use Wallaby.js on a non-open-source project beyond the 15-day trial license period, you may obtain a license key from the wallaby website.

Add License Key To VS Code

After obtaining a license key, head over to VS Code and in the command palette search for "Wallaby.js: Manage License Key", click on the command and you will be presented with an input box to enter your license key, then hit enter and you will receive a notification that Wallaby.js has been successfully activated.

Wallaby.js And React

Now that we have Wallaby.js set up in our VS Code editor, let’s supercharge testing a React application with Wallaby.js.

For our React app, we will add a simple upvote/downvote feature and we will write some tests for our new feature to see how Wallaby.js plays out in the mix.

Creating The React App

Note: You can clone the demo repo if you like, or you can follow along below.

We will create our React app using the create-react-app CLI tool.

npx create-react-app wallaby-js-demo

Then open the newly scaffolded React project in VS Code.

Open src/App.js and start Wallaby.js by running: "Wallaby.js: Start" in VS Code command palette (alternatively you can use the shortcut combo — Ctrl + Shift + R R if you are on a Windows or Linux machine, or Cmd + Shift + R R if you are on a Mac).

When Wallaby.js starts you should see its test coverage indicators to the left of your editor similar to the screenshot below:

Wallaby.js provides 5 different colored indicators in the left margin of your code editor:

  1. Gray: means that the line of code is not executed by any of your tests.
  2. Yellow: means that some of the code on a given line was executed but other parts were not.
  3. Green: means that all of the code on a line was executed by your tests.
  4. Pink: means that the line of code is on the execution path of a failing test.
  5. Red: means that the line of code is the source of an error or failed expectation, or in the stack of an error.

If you look at the status bar you will see Wallaby.js metrics for this file and it’s showing we have a 100% test coverage for src/App.js and a single passing test with no failing test. How does Wallaby.js know this? When we started Wallaby.js, it detected src/App.js has a test file src/App.test.js, it then runs those tests in the background for us and conveniently gives us the feedbacks using its color indicators and also giving us a summary metric on our tests in the status bar.

When you also open src/App.test.js you will see similar feedback from Wallaby.js

Currently, all tests are passing at the moment so we get all green indicators. Let’s see how Wallaby.js handles failing tests. In src/App.test.js let’s make the test fail by changing the expectation of the test like so:

// src/App.test.js
expect(linkElement).not.toBeInTheDocument();

The screenshot below shows how your editor would now look with src/App.test.js open:

You will see the indicators change to red and pink for the failing tests. Also notice we didn’t have to save the file for Wallaby.js to detect we made a change.

You will also notice the line in your editor in src/App.test.js that outputs the error of the test. This is done thanks to Wallaby.js advanced logging. Using Wallaby.js advanced logging, you can also report and explore runtime values beside your code using console.log, a special comment format //? and the VS Code command, Wallaby.js: Show Value.

Now let’s see the Wallaby.js workflow for fixing failing tests. Click on the Wallaby.js test indicator in the status bar to open the Wallaby.js output window. ("✗ 1 ✓ 0")

In the Wallaby.js output window, right next to the failing test, you should see a “Debug Test” link. Pressing Ctrl and clicking on that link will fire up the Wallaby.js time travel debugger. When we do that, the Wallaby.js Tools window will open to the side of your editor, and you should see the Wallaby.js debugger section as well as the Value explorer and Test file coverage sections.

If you want to see the runtime value of a variable or expression, select the value in your editor and Wallaby.js will display it for you.

Also, notice the "Open Test Story" link in the output window. Wallby.js test story allows you to see all your tests and the code they are testing in a single view in your editor.

Let’s see this in action. Press Ctrl and click on the link — you should be able to see the Wallaby.js test story open up in your editor. Wallaby’s Test Story Viewer provides a unique and efficient way of inspecting what code your test is executing in a single logical view.

Another thing we will explore before fixing our failing test is the Wallaby.js app. Notice the link in the Wallaby.js output window: “Launch Coverage & Test Explorer”. Clicking on the link will launch the Wallaby.js app which will give you a compact birds-eye view of all tests in your project.

Next, click on the link and start up the Wallaby.js app in your default browser via http://localhost:51245/. Wallaby.js will quickly detect that we have our demo project open in our editor which will then automatically load it into the app.

Here is how the app should now look like:

You should be able to see the test’s metrics on the top part of the Wallaby.js app. By default, the Tests tab in the app is opened up. By clicking on the Files tab, you should be able to see the files in your project as well as their test coverage reports.

Back on to the Tests tab, click on the test and you should see the Wallaby.js error reporting feature to the right:

Now we’ve covered all that, go back to the editor, and fix the failing test to make Wallaby.js happy by reverting the line we changed earlier to this:

expect(linkElement).toBeInTheDocument();

The Wallaby.js output window should now look like the screenshot below and your test coverage indicators should be all passing now.

Implementing Our Feature

We’ve explored Wallaby.js in the default app created for us by create-react-app. Let’s implement our upvote/downvote feature and write tests for that.

Our application UI should contain two buttons one for upvoting and the other for downvoting and a single counter that will be incremented or decremented depending on the button the user clicks. Let’s modify src/App.js to look like this.

// src/App.js
import React, { useState } from 'react';
import logo from './logo.svg';
import './App.css';

function App() {
  const [vote, setVote] = useState(0);

  function upVote() {
    setVote(vote + 1);
  }

  function downVote() {
    // Note the error, we will fix this later...
    setVote(vote - 2);
  }
  return (
    <div className='App'>
      <header className='App-header'>
        <img src={logo} className='App-logo' alt='logo' />
        <p className='vote' title='vote count'>
          {vote}
        </p>
        <section className='votes'>
          <button title='upVote' onClick={upVote}>
            <span role='img' aria-label='Up vote'>
              👍🏿
            </span>
          </button>
          <button title='downVote' onClick={downVote}>
            <span role='img' aria-label='Down vote'>
              👎🏿
            </span>
          </button>
        </section>
      </header>
    </div>
  );
}

export default App;

We will also style the UI just a bit. Add the following rules to src/index.css

.votes {
  display: flex;
  justify-content: space-between;
}
p.vote {
  font-size: 4rem;
}
button {
  padding: 2rem 2rem;
  font-size: 2rem;
  border: 1px solid #fff;
  margin-left: 1rem;
  border-radius: 100%;
  transition: all 300ms;
  cursor: pointer;
}

button:focus,
button:hover {
  outline: none;
  filter: brightness(40%);
}

If you look at src/App.js, you will notice some gray indicators from Wallaby.js hinting us that some part of our code isn’t tested yet. Also, you will notice our initial test in src/App.test.js is failing and the Wallaby.js status bar indicator shows that our test coverage has dropped.

These visual clues by Wallaby.js are convenient for test-driven development (TDD) since we get instant feedback on the state of our application regarding tests.

Testing Our App Code

Let’s modify src/App.test.js to check that the app renders correctly.

Note: We will be using React Testing Library for our test which comes out of the box when you run create-react-app. See the docs for usage guide.

We are going to need a couple of extra functions from @testing-library/react, update your @testing-library/react import to:

import { render, fireEvent, cleanup } from '@testing-library/react';

Then let’s replace the single test in src/App.js with:

test('App renders correctly', () => { render(<App />); });

Immediately you will see the indicator go green in both the src/App.test.js line where we test for the render of the app and also where we are calling render in our src/App.js.

Next, we will test that the initial value of the vote state is zero(0).

it('Vote count starts at 0', () => {
  const { getByTitle } = render(<App />);
  const voteElement = getByTitle('vote count');
  expect(voteElement).toHaveTextContent(/^0$/);
});

Next, we will test if clicking the upvote 👍🏿 button increments the vote:

it('Vote increments by 1 when upVote button is pressed', () => {
  const { getByTitle } = render(<App />);
  const upVoteButtonElement = getByTitle('upVote');
  const voteElement = getByTitle('vote count');
  fireEvent.click(upVoteButtonElement);
  expect(voteElement).toHaveTextContent(/^1$/);
});

We will also test for the downvote 👎🏿 interaction like so:

it('Vote decrements by 1 when downVote button is pressed', () => {
  const { getByTitle } = render(<App />);
  const downVoteButtonElement = getByTitle('downVote');
  const voteElement = getByTitle('vote count');
  fireEvent.click(downVoteButtonElement);
  expect(voteElement).toHaveTextContent(/^-1$/);
});

Oops, this test is failing. Let’s work out why. Above the test, click the View story code lens link or the Debug Test link in the Wallaby.js output window and use the debugger to step through to the downVote function. We have a bug... we should have decremented the vote count by 1 but instead, we are decrementing by 2. Let’s fix our bug and decrement by 1.

src/App.js
function downVote() {
    setVote(vote - 1);
}

Watch now how Wallaby’s indicators go green and we know that all of our tests are passing:

Conclusion

From this article, you have seen how Wallaby.js improves your developer experience when testing JavaScript applications. We have investigated some key features of Wallaby.js, set it up in VS Code, and then tested a React application with Wallaby.js.

Further Resources

How To Automate API Testing With Postman

One of my favorite features in Postman is the ability to write automated tests for my APIs. So if you are like me and you use Postman and you are tired of manually testing your APIs, this article will show how to harness the test automation feature provided by Postman.

In case you don’t know what Postman is or you are entirely new to Postman, I will recommend you check out the Postman getting started documentation page and then come back to this article to learn how to automate testing your API with Postman.

APIs or Web APIs pretty much drive most of the user-facing digital products. With that said, as a backend or front-end developer being able to test these APIs with ease and more efficiently will allow you to move quickly in your development lifecycle.

Postman allows you to manually test your APIs in both its desktop and web-based applications. However, it also has the ability for you to automate these tests by writing JavaScript assertions on your API endpoints.

Why You Should Automate API Tests

Testing in software development is used to ascertain the quality of any piece of software. If you are building APIs as a backend for a single frontend application or you are building APIs to be consumed by several services and clients, it’s important that the APIs work as expected.

Setting up automated API tests to test the different endpoints in your API will help catch bugs as quickly as possible.

It will also allow you to move quickly and add new features because you can simply run the test cases to see if you break anything along the way.

Steps To Automating API Tests

When writing API tests in Postman, I normally take a four step approach:

  1. Manually testing the API;
  2. Understand the response returned by the API;
  3. Write the automated test;
  4. Repeat for each endpoint on the API.

For this article, I have a NodeJS web service powered by SailsJS that expose the following endpoints for:

  • / — the home of the API.
  • /user/signup — Signs up a new user.
  • /user/signin — Signs in an exiting user.
  • /listing/new — Creates a new listing(a listing is details of a property owned by the user) for an existing user.

I have created and organized the endpoints for the demo service we would be using in this article in a Postman collection so you can quickly import the collection in postman by clicking the button below and follow along.

So let’s follow my four steps to automating API tests in Postman.

1. Test The API Manually

I will open Postman and switch over to a workspace I created called demo which has the postman-test-demo-service collection. You will also have access to the collection if you imported it from above. So my postman would look like this:

Our first test is to test the home endpoint(/) of the API. So I would open the request on the sidebar called home you can see it’s a Get request and by simply pressing Enter, I would send a GET request to the web service to see what it responds with. The image below shows that response:

2. Understand The Response Returned By The API

If you are following along and also from the screenshot above you will see the response came back with a status code of 200 OK and also a JSON body with a message property with the value of You have reached postman test demo web service

Knowing this is the expected response of the / endpoint on our service, we can proceed to step 3 — writing the actual automated test.

3. Write The Automated Test

Postman comes out of the box with a powerful runtime based on Node.js which gives it’s users the ability to write scripts in the JavaScript language.

In Postman, you add scripts to be executed during two events in the Postman workflow:

  • Before you make a request.
    These scripts are called pre-request script and you can write them under the Pre-request Script tab.
  • After you’ve received a response from the request you made.
    These scripts are called Test scripts and it is this set of scripts that are our focus in this article. You write test scripts under the Tests tab in a Postman request.

The image below shows the Tests tab opened in Postman:

If you look to your right in the already opened request Tests tab, you will notice a list of snippets available to quickly get you started writing tests. Most of the time, these snippets are sufficient for quite a number of test scenarios. So I would select the snippet title Status code: Code is 200. This will generate the code below in the Tests editor:

pm.test("Status code is 200", function () {
    pm.response.to.have.status(200);
});

Here is also how Postman would look like after clicking on that test snippet:

If you’ve written any form of tests in JavaScript using some of the testing frameworks out there like Jest, then the snippet above will seem familiar. But let me explain: All postman test suits or scenario begins with test() function which is exposed in the pm(short for Postman) global object provided by Postman for you. The test method takes two arguments: the first is the test description which in our test suite above reads: Status code is 200, the second argument is a callback function. It’s in this function you make your assertions or verification of the response on the particular request being tested.

You will notice we have a single assertion right now but you can have as many as you want. However, I like keeping assertions in separate tests most of the time.

Our assertion above simply asks Postman if the response return has a status code of 200. You could see how it reads like English. This is intentional in order to allow anyone to write these tests with ease.

Running Our Test

To run our test we will send a request to the endpoint again. Only this time around, when Postman receives the response from that request, it will run your tests. Below is an image showing the passing test in Postman (You can access test result on the Test Results tab of the response section in postman):

So our test passed! However, it’s crucial that we make our test scenario fail first, and then make it pass; this will help make sure that the scenario you are testing is not affected by any external factor, and that the test passes for the reason you are expecting it to pass — not something else. A good test should be predictable and the end result should be known beforehand.

To make our test pass, I will make a typo in the URL we are currently sending the GET request to. This will lead to a 404 Not Found status code which will make our test fail. Let’s do this. In the address bar currently having the variable of our baseUrl, I will add /a to it (it could be anything random actually). Making the request again and our test will fail like seen below:

Removing the string /a will make the test pass again.

We have written an automated test for the home route of our demo web service. At the moment we have a test case checking the status of the response. Let’s write another test case checking if the response body contains a message property as we have seen in the response and the value is 'You have reached postman test demo web service'. Add the below code snippet to the test editor:

pm.test("Contains a message property", function() {
    let jsonData = pm.response.json();
    pm.expect(jsonData.message).to.eql("You have reached postman test demo web service");
})

Your Postman window should look like this:

In the snippet above, we are creating a test case and getting the JavaScript object equivalent of the response body of the request which is originally in JSON by calling json() on it. Then we use the expect assertion method to check if the message property has a value of "You have reached postman test demo web service."

4. Repeat!

I believe from the above first iteration of our 4 steps to writing API tests that you’ve seen the flow. So we would be repeating this flow to test all requests in the demo web service. Next up is the signup request. Let’s test on!

Signup Request

The signup request is a POST request expecting the fullName, emailAddress, and password of a user. In postman, you can add these parameters in many ways however we would opt into x-www-form-urlencoded method in the Body tabs of the request section. The image below gives an example of the parameters:

Here is the response with the above request:

{
    "message": "An account has been created for kelvinomereshone@gmail.com successfully",
    "data": {
        "createdAt": 1596634791698,
        "updatedAt": 1596634791698,
        "id": "9fa2e648-1db5-4ea9-89a1-3be5bc73cb34",
        "emailAddress": "kelvinomereshone@gmail.com",
        "fullName": "Kelvin Omereshone"
    },
    "token": "eyJhbGciOiJIUzI1NiIsInR5cCI6IkpXVCJ9.eyJzdWIiOiJrZWx2aW5vbWVyZXNob25lQGdtYWlsLmNvbSIsImlzcyI6Ik15UGFkaSBCYWNrZW5kIiwiaWF0IjoxNTk2NjM0NzkxfQ.otCcXSmhP4mNWAHnrYvvzHkgU8yX8yRE5rcVtmGJ68k"
}

From the above response body, you will notice a token property is returned with the response body. So we would write a test case to assert if a JSON response body was returned and if it contains the property token. Also, we would check for the status code as well which returns 201 Created. So open the Tests tab and add the following snippets:

pm.test("Status code is 201", function () {
    pm.response.to.have.status(201);
});


pm.test("Response has a JSON body", function () {
    pm.response.to.be.json;
});

pm.test("Response has a token property", function () {
    var jsonData = pm.response.json();
    pm.expect(jsonData.token).to.be.a('string');
});

What each test case does should be obvious enough from the test description. From top to bottom, we check if the response is a 201 Created status code, we assert also if the response body is JSON and lastly we assert if the token property has a value of type string. Let’s run our tests.

Note: Make sure you change at least the email address of the new user as the Web service won’t allow for duplicate emails.

Our tests should pass and when you check the Test Results tab of the Response section you should get 3 passing tests as shown below:

Let’s move onward to testing the signin endpoint...

Signin Request

The signin request’s response body is similar to the signup request. You could verify that by hitting the endpoint with user credentials - emailAddress and Password - you signed up already. After you have done that, add the following test cases to the tests editor:

pm.test("Status code is 200", function () {
    pm.response.to.have.status(200);
});


pm.test("Response has a JSON body", function () {
    pm.response.to.be.json;
});

pm.test("Response has a token property", function () {
    var jsonData = pm.response.json();
    pm.expect(jsonData.token).to.be.a('string');
});


pm.test("Response has a data property", function () {
    var jsonData = pm.response.json();
    pm.expect(jsonData.data).to.be.a('object');
});

Make the request to signin with a valid user credential and your test should pass and Postman should look like so:

Finally, we would be testing the listing/new endpoint of our demo API.

Listing/New Request

This test would be a little different. According to the requirement of our fictitious API, only logged in users can create listings. So we would need a way to authenticate the request.

Recall when signing in a JWT token was returned we can use that token as the authorization header for the create listing request.

To do this in postman, simply copy the token you got from signing in and go over to the Authorization tab of the Request section in Postman and select the type to be Bearer Token from the Type dropdown. You can then paste the token in the box to your right labeled Token. So the new request Authorization tab should look like this:

You can then go on and add the parameters in the Body tab of the request. You will notice the fields name are already there with sample values which you can choose to edit or not. Let’s make a request first before writing our test. A successful response will look like so:

{
    "message": "New listing created successfully",
    "data": {
        "createdAt": 1596637153470,
        "updatedAt": 1596637153470,
        "id": "41d922ce-7326-43eb-93c8-31658c59e45d",
        "name": "Glorious Lounge",
        "type": "Hotel",
        "address": "No 1. Something street",
        "rent": "$100k per year",
        "lister": "9fa2e648-1db5-4ea9-89a1-3be5bc73cb34"
    }
}

We can see we get a JSON response body back. We can test for that and also make sure data is not empty. Add the following test case to the Test tab:

pm.test("Status code is 200", function () {
    pm.response.to.have.status(200);
});


pm.test("Response has a JSON body", function () {
    pm.response.to.be.json;
});

pm.test("Response has a message property", function () {
    var jsonData = pm.response.json();
    pm.expect(jsonData.message).to.be.a('string');
});


pm.test("Response has a data property", function () {
    var jsonData = pm.response.json();
    pm.expect(jsonData.data).to.be.a('object');
});

With that added, make another request and the tests should all pass as shown below:

Conclusion

This article aims at showing you how to utilize Postman to write automated tests for your APIs which will allow you to bridge the gap between development and quality assurance, and also minimize the surface area of bugs in your API.

Additional Resources

Better Error Handling In NodeJS With Error Classes

Better Error Handling In NodeJS With Error Classes

Better Error Handling In NodeJS With Error Classes

Kelvin Omereshone

Error handling is one of those parts of software development that don’t quite get the amount of attention it really deserves. However, building robust applications requires dealing with errors properly.

You can get by in NodeJS without properly handling errors but due to the asynchronous nature of NodeJS, improper handling or errors can cause you pain soon enough — especially when debugging applications.

Before we proceed, I would like to point out the type of errors we’ll be discussing how to utilize error classes.

Operational Errors

These are errors discovered during the run time of a program. Operational errors are not bugs and can occur from time to time mostly because of one or a combination of several external factors like a database server timing out or a user deciding to make an attempt on SQL injection by entering SQL queries in an input field.

Below are more examples of operational errors:

  • Failed to connect to a database server;
  • Invalid inputs by the user (server responds with a 400 response code);
  • Request timeout;
  • Resource not found (server responds with a 404 response code);
  • Server returns with a 500 response.

It’s also worthy of note to briefly discuss the counterpart of Operational Errors.

Programmer Errors

These are bugs in the program which can be resolved by changing the code. These types of errors can not be handled because they occur as a result of the code being broken. Example of these errors are:

  • Trying to read a property on an object that is not defined.
 const user = {
   firstName: 'Kelvin',
   lastName: 'Omereshone',
 }

 console.log(user.fullName) // throws 'undefined' because the property fullName is not defined
  • Invoking or calling an asynchronous function without a callback.
  • Passing a string where a number was expected.

This article is about Operational Error handling in NodeJS. Error handling in NodeJS is significantly different from error handling in other languages. This is due to the asynchronous nature of JavaScript and the openness of JavaScript with errors. Let me explain:

In JavaScript, instances of the error class is not the only thing you can throw. You can literally throw any data type this openness is not allowed by other languages.

For example, a JavaScript developer may decide to throw in a number instead of an error object instance, like so:

// bad
throw 'Whoops :)';

// good
throw new Error('Whoops :)')

You might not see the problem in throwing other data types, but doing so will result in a harder time debugging because you won’t get a stack trace and other properties that the Error object exposes which are needed for debugging.

Let’s look at some incorrect patterns in error handling, before taking a look at the Error class pattern and how it is a much better way for error handling in NodeJS.

Bad Error Handling Pattern #1: Wrong Use Of Callbacks

Real-world scenario: Your code depends on an external API requiring a callback to get the result you expect it to return.

Let’s take the below code snippet:

'use strict';

const fs = require('fs');

const write = function () {
    fs.mkdir('./writeFolder');
    fs.writeFile('./writeFolder/foobar.txt', 'Hello World');
}

write();

Until NodeJS 8 and above, the above code was legitimate, and developers would simply fire and forget commands. This means developers weren’t required to provide a callback to such function calls, and therefore could leave out error handling. What happens when the writeFolder hasn’t been created? The call to writeFile won’t be made and we wouldn’t know anything about it. This might also result in race condition because the first command might not have finished when the second command started again, you wouldn’t know.

Let’s start solving this problem by solving the race condition. We would do so by giving a callback to the first command mkdir to ensure the directory indeed exists before writing to it with the second command. So our code would look like the one below:

'use strict';

const fs = require('fs');

const write = function () {
    fs.mkdir('./writeFolder', () => {
        fs.writeFile('./writeFolder/foobar.txt', 'Hello World!');
    });
}

write();

Though we solved the race condition, we are not done quite yet. Our code is still problematic because even though we used a callback for the first command, we have no way of knowing if the folder writeFolder was created or not. If the folder wasn’t created, then the second call will fail again but still, we ignored the error yet again. We solve this by…

Error Handling With Callbacks

In order to handle error properly with callbacks, you must make sure you always use the error-first approach. What this means is that you should first check if there is an error returned from the function before going ahead to use whatever data(if any) was returned. Let’s see the wrong way of doing this:

'use strict';


// Wrong
const fs = require('fs');

const write = function (callback) {
    fs.mkdir('./writeFolder', (err, data) => {
        if (data) fs.writeFile('./writeFolder/foobar.txt', 'Hello World!');
        else callback(err)
    });
}

write(console.log);

The above pattern is wrong because sometimes the API you are calling might not return any value or might return a falsy value as a valid return value. This would make you end up in an error case even though you might apparently have a successful call of the function or API.

The above pattern is also bad because it’s usage would eat up your error(your errors won’t be called even though it might have happened). You will also have no idea of what is happening in your code as a result of this kind of error handling pattern. So the right way for the above code would be:

'use strict';

// Right
const fs = require('fs');

const write = function (callback) {
    fs.mkdir('./writeFolder', (err, data) => {
        if (err) return callback(err)
        fs.writeFile('./writeFolder/foobar.txt', 'Hello World!');
    });
}

write(console.log);

Wrong Error Handling Pattern #2: Wrong Use Of Promises

Real-world scenario: So you discovered Promises and you think they are way better than callbacks because of callback hell and you decided on promisifying some external API your code base depended upon. Or you are consuming a promise from an external API or a browser API like the fetch() function.

These days we don’t really use callbacks in our NodeJS codebases, we use promises. So let’s reimplement our example code with a promise:

'use strict';

const fs = require('fs').promises;

const write = function () {
    return fs.mkdir('./writeFolder').then(() => {
        fs.writeFile('./writeFolder/foobar.txt', 'Hello world!')
    }).catch((err) => {
        // catch all potential errors
        console.error(err)
    })
}

Let’s put the above code under a microscope — we can see that we are branching off the fs.mkdir promise into another promise chain(the call to fs.writeFile) without even handling that promise call. You might think a better way to do it would be:

'use strict';

const fs = require('fs').promises;

const write = function () {
    return fs.mkdir('./writeFolder').then(() => {
        fs.writeFile('./writeFolder/foobar.txt', 'Hello world!').then(() => {
            // do something
        }).catch((err) => {
            console.error(err);
        })
    }).catch((err) => {
        // catch all potential errors
        console.error(err)
    })
}

But the above would not scale. This is because if we have more promise chain to call, we would end up with something similar to the callback hell which promises were made to solve. This means our code will keep indenting to the right. We would have a promise hell on our hands.

Promisifying A Callback-Based API

Most times you would want to promisify a callback-based API on your own in order to better handle errors on that API. However, this is not really easy to do. Let’s take an example below to explain why.

function doesWillNotAlwaysSettle(arg) {
    return new Promise((resolve, reject) => {
       doATask(foo, (err) => {
           if (err) {
                return reject(err);
            }

            if (arg === true) {
                resolve('I am Done')
            }
        });
    });
}

From the above, if arg is not true and we don’t have an error from the call to the doATask function then this promise will just hang out which is a memory leak in your application.

Swallowed Sync Errors In Promises

Using the Promise constructor has several difficulties one of these difficulties is; as soon as it is either resolved or rejected it cannot get another state. This is because a promise can only get a single state — either it is pending or it is resolved/rejected. This means we can have dead zones in our promises. Let’s see this in code:

function deadZonePromise(arg) {
    return new Promise((resolve, reject) => {
        doATask(foo, (err) => {
            resolve('I’m all Done');
            throw new Error('I am never reached') // Dead Zone
        });
    });
}

From the above we see as soon as the promise is resolved, the next line is a dead zone and will never be reached. This means any following synchronous error handling perform in your promises will just be swallowed and will never be thrown.

Real-World Examples

The examples above help explain poor error handling patterns, let’s take a look at the sort of problems you might see in real-life.

Real World Example #1 — Transforming Error To String

Scenario: You decided the error returned from an API is not really good enough for you so you decided to add your own message to it.

'use strict';

function readTemplate() {
    return new Promise(() => {
      databaseGet('query', function(err, data) {
          if (err) {
           reject('Template not found. Error: ', + err);
          } else {
            resolve(data);
          }
        });
    });
}

readTemplate();

Let’s look at what is wrong with the above code. From the above we see the developer is trying to improve the error thrown by the databaseGet API by concatenating the returned error with the string “Template not found”. This approach has a lot of downsides because when the concatenation was done, the developer implicitly runs toString on the error object returned. This way he loses any extra information returned by the error(say goodbye to stack trace). So what the developer has right now is just a string that is not useful when debugging.

A better way is to keep the error as it is or wrap it in another error that you’ve created and attached the thrown error from the databaseGet call as a property to it.

Real-World Example #2: Completely Ignoring The Error

Scenario: Perhaps when a user is signing up in your application, if an error occur you want to just catch the error and show a custom message but you completely ignored the error that was caught without even logging it for debugging purposes.

router.get('/:id', function (req, res, next) {
    database.getData(req.params.userId)
    .then(function (data) {
        if (data.length) {
            res.status(200).json(data);
        } else {
            res.status(404).end();
        }
    })
    .catch(() => {
        log.error('db.rest/get: could not get data: ', req.params.userId);
        res.status(500).json({error: 'Internal server error'});
    })
});

From the above, we can see that the error is completely ignored and the code is sending 500 to the user if the call to the database failed. But in reality, the cause for the database failure might be malformed data sent by the user which is an error with the status code of 400.

In the above case, we would be ending up in a debugging horror because you as the developer wouldn’t know what went wrong. The user won’t be able to give a decent report because 500 internal server error is always thrown. You would end up wasting hours in finding the problem which will tantamount to wastage of your employer’s time and money.

Real-World Example #3: Not Accepting The Error Thrown From An API

Scenario: An error was thrown from an API you were using but you don’t accept that error instead you marshall and transform the error in ways that make it useless for debugging purposes.

Take the following code example below:

async function doThings(input) {
    try {
        validate(input);
        try {
            await db.create(input);
        } catch (error) {
            error.message = `Inner error: ${error.message}`

            if (error instanceof Klass) {
                error.isKlass = true;
            }

            throw error
        }
    } catch (error) {
        error.message = `Could not do things: ${error.message}`;
        await rollback(input);
        throw error;
    }
}

A lot is going on in the above code that would lead to debugging horror. Let’s take a look:

  • Wrapping try/catch blocks: You can see from the above that we are wrapping try/catch block which is a very bad idea. We normally try to reduce the use of try/catch blocks to minify the surface where we would have to handle our error (think of it as DRY error handling);
  • We are also manipulating the error message in the attempt to improve which is also not a good idea;
  • We are checking if the error is an instance of type Klass and in this case, we are setting a boolean property of the error isKlass to truev(but if that check passes then the error is of the type Klass);
  • We are also rolling back the database too early because, from the code structure, there is a high tendency that we might not have even hit the database when the error was thrown.

Below is a better way to write the above code:

async function doThings(input) {
    validate(input);

    try {
        await db.create(input);
    } catch (error) {
        try {
            await rollback();
        } catch (error) {
            logger.log('Rollback failed', error, 'input:', input);
        }
        throw error;
    }
}

Let’s analyze what we are doing right in the above snippet:

  • We are using one try/catch block and only in the catch block are we using another try/catch block which is to serve as a guard in case something goes on with that rollback function and we are logging that;
  • Finally, we are throwing our original received error meaning we don’t lose the message included in that error.

Testing

We mostly want to test our code(either manually or automatically). But most times we are only testing for the positive things. For a robust test, you must also test for errors and edge cases. This negligence is responsible for bugs finding their way into production which would cost more extra debugging time.

Tip: Always make sure to test not only the positive things(getting a status code of 200 from an endpoint) but also all the error cases and all the edge cases as well.

Real-World Example #4: Unhandled Rejections

If you’ve used promises before, you have probably run into unhandled rejections.

Here is a quick primer on unhandled rejections. Unhandled rejections are promise rejections that weren’t handled. This means that the promise was rejected but your code will continue running.

Let’s look at a common real-world example that leads to unhandled rejections..

'use strict';

async function foobar() {
    throw new Error('foobar');
}

async function baz() {
    throw new Error('baz')
}


(async function doThings() {
    const a = foobar();
    const b = baz();

    try {
        await a;
        await b;
    } catch (error) {
        // ignore all errors!
    }
})();

The above code at first look might seem not error-prone. But on a closer look, we begin to see a defect. Let me explain: What happens when a is rejected? That means await b is never reached and that means its an unhandled rejection. A possible solution is to use Promise.all on both promises. So the code would read like so:

'use strict';

async function foobar() {
    throw new Error('foobar');
}

async function baz() {
    throw new Error('baz')
}


(async function doThings() {
    const a = foobar();
    const b = baz();

    try {
        await Promise.all([a, b]);
    } catch (error) {
        // ignore all errors!
    }
})();

Here is another real-world scenario that would lead to an unhandled promise rejection error:

'use strict';

async function foobar() {
    throw new Error('foobar');
}

async function doThings() {
    try {
        return foobar()
    } catch {
        // ignoring errors again !
    }
}

doThings();

If you run the above code snippet, you will get an unhandled promise rejection, and here is why: Although it’s not obvious, we are returning a promise (foobar) before we are handling it with the try/catch. What we should do is await the promise we are handling with the try/catch so the code would read:

'use strict';

async function foobar() {
    throw new Error('foobar');
}

async function doThings() {
    try {
        return await foobar()
    } catch {
        // ignoring errors again !
    }
}

doThings();

Wrapping Up On The Negative Things

Now that you have seen wrong error handling patterns, and possible fixes, let’s now dive into Error class pattern and how it solves the problem of wrong error handling in NodeJS.

Error Classes

In this pattern, we would start our application with an ApplicationError class this way we know all errors in our applications that we explicitly throw are going to inherit from it. So we would start off with the following error classes:

  • ApplicationError
    This is the ancestor of all other error classes i.e all other error classes inherits from it.
  • DatabaseError
    Any error relating to Database operations will inherit from this class.
  • UserFacingError
    Any error produced as a result of a user interacting with the application would be inherited from this class.

Here is how our error class file would look like:

'use strict';

// Here is the base error classes to extend from

class ApplicationError extends Error {
    get name() {
        return this.constructor.name;
    }
}

class DatabaseError extends ApplicationError { }

class UserFacingError extends ApplicationError { }

module.exports = {
    ApplicationError,
    DatabaseError,
    UserFacingError
}

This approach enables us to distinguish the errors thrown by our application. So now if we want to handle a bad request error (invalid user input) or a not found error (resource not found) we can inherit from the base class which is UserFacingError (as in the code below).

const { UserFacingError } = require('./baseErrors')

class BadRequestError extends UserFacingError {
    constructor(message, options = {}) {
        super(message);

        // You can attach relevant information to the error instance
        // (e.g.. the username)

        for (const [key, value] of Object.entries(options)) {
            this[key] = value;
        }
    }

    get statusCode() {
        return 400;
    }
}


class NotFoundError extends UserFacingError {
    constructor(message, options = {}) {
        super(message);

        // You can attach relevant information to the error instance
        // (e.g.. the username)

        for (const [key, value] of Object.entries(options)) {
            this[key] = value;
        }
    }
    get statusCode() {
        return 404
    }
}

module.exports = {
    BadRequestError,
    NotFoundError
}

One of the benefits of the error class approach is that if we throw one of these errors, for example, a NotFoundError, every developer reading this codebase would be able to understand what is going on at this point in time(if they read the code).

You would be able to pass in multiple properties specific to each error class as well during the instantiation of that error.

Another key benefit is that you can have properties that are always part of an error class, for example, if you receive a UserFacing error, you would know that a statusCode is always part of this error class now you can just directly use it in the code later on.

Tips On Utilizing Error Classes

  • Make your own module(possibly a private one) for each error class that way you can simply import that in your application and use it everywhere.
  • Throw only errors that you care about(errors that are instances of your error classes). This way you know your error classes are your only Source of Truth and it contains all information necessary to debug your application.
  • Having an abstract error module is quite useful because now we know all necessary information concerning errors our applications can throw are in one place.
  • Handle errors in layers. If you handle errors everywhere, you have an inconsistent approach to error handling which is hard to keep track of. By layers I mean like database, express/fastify/HTTP layers, and so on.

Let’s see how error classes looks in code. Here is an example in express:

const { DatabaseError } = require('./error')
const { NotFoundError } = require('./userFacingErrors')
const { UserFacingError } = require('./error')

// Express
app.get('/:id', async function (req, res, next) {
    let data

    try {
        data = await database.getData(req.params.userId)
    } catch (err) {
        return next(err);
    }

    if (!data.length) {
        return next(new NotFoundError('Dataset not found'));
    }

    res.status(200).json(data)
})

app.use(function (err, req, res, next) {
    if (err instanceof UserFacingError) {
        res.sendStatus(err.statusCode);

        // or

        res.status(err.statusCode).send(err.errorCode)
    } else {
        res.sendStatus(500)
    }

    // do your logic
    logger.error(err, 'Parameters: ', req.params, 'User data: ', req.user)
});

From the above, we are leveraging that Express exposes a global error handler which allows you handle all your errors in one place. You can see the call to next() in the places we are handling errors. This call would pass the errors to the handler which is defined in the app.use section. Because express does not support async/await we are using try/catch blocks.

So from the above code, to handle our errors we just need to check if the error that was thrown is a UserFacingError instance and automatically we know that there would be a statusCode in the error object and we send that to the user (you might want to have a specific error code as well which you can pass to the client) and that is pretty much it.

You would also notice that in this pattern (error class pattern) every other error that you did not explicitly throw is a 500 error because it is something unexpected that means you did not explicitly throw that error in your application. This way, we are able to distinguish the types of error going on in our applications.

Conclusion

Proper error handling in your application can make you sleep better at night and save debug time. Here are some takeaway key points to take from this article:

  • Use error classes specifically set up for your application;
  • Implement abstract error handlers;
  • Always use async/await;
  • Make errors expressive;
  • User promisify if necessary;
  • Return proper error statuses and codes;
  • Make use of promise hooks.
Smashing Editorial (ra, yk, il)

How To Build An Accessible Front-End Application With Chakra UI And Nuxt.js

How To Build An Accessible Front-End Application With Chakra UI And Nuxt.js

How To Build An Accessible Front-End Application With Chakra UI And Nuxt.js

Kelvin Omereshone

For many people, the web is an essential part of their daily lives. They use it at work, home, and even on the road. Web accessibility means people with disabilities can use the web equally. So it’s crucial for developers and organizations building on the web to build inclusivity and accessibility into their applications.

In order to make the web more accessible, there are a couple of best practices and standards that you will have to implement in your applications, such as adhering to the following:

Learning to implement these standards can seem like a daunting task when you factor in project deadlines and other constraints that you have to work with as a developer. In that light, let me introduce you to a UI design system that was built to help you make your web applications accessible.

Chakra UI

Chakra UI is a design system and UI framework created by Segun Adebayo. It was created with simplicity, modularity, composability, and accessibility in mind. Chakra UI gives you all the building blocks needed to create accessible front-end applications.

Note: While Chakra UI depends on CSS-in-JS under the hood, you don’t need to know it in order to use the library.

Though the framework was originally created for React, Jonathan Bakebwa spear-headed the porting to Vue. So Vuejs/NuxtJS developers can now utilize Chakra UI to create accessible web applications.

Features Of Chakra UI

Chakra UI was created with the following principles in mind:

  • Style props
    Chakra UI makes it possible to style components or override their styles by using props. This reduces the need for stylesheet or inline styles. Chakra UI achieves this level of flexibility by using Styled Systems under the hood.
  • Composition
    Components in Chakra UI have been broken down into smaller parts with minimal props to keep complexity low, and compose them together. This will ensure that the styles and functionality are flexible and extensible. For example, you can use the CBox and CPseudoBox components to create new components.
  • Accessible
    Chakra UI components follow the WAI-ARIA guidelines specifications and have the right aria-* attributes. You can also find the accessibility report of each authored component in a file called accessibility.md. See the accessibility report for the CAccordion component.
  • Themeable
    Chakra UI affords you the ability to easily reference values from your theme throughout your entire application, on any component.
  • Dark mode support
    Most components in Chakra UI are dark mode compatible right out of the box.

How Chakra UI Supports Accessibility

One of the core principles behind the creation of Chakra UI is accessibility. With that in mind, all components in Chakra UI comes out of the box with support for accessibility by providing:

  • Keyboard Navigation — useful for users with motor skills disabilities,
  • Focus Management,
  • aria-* attributes which are needed by screen readers,
  • Focus trapping and restoration for modal dialogs.

Getting Started With Chakra UI And Nuxt

Note: To use Chakra UI with Vue.js see the Getting Started guide.

For our demo project, we will be building Chakra-ui explorer — an accessible single-page web application to search Chakra UI components.

Getting Started With Chakra-ui Explorer

Assuming you already have NPM installed, create a new Nuxt application by running:

$ npx create-nuxt-app chakra-ui-explorer

Or if you prefer in yarn, then run:

$ yarn create nuxt-app chakra-ui-explorer

Follow the installation prompt to finish creating your Nuxt application.

Setting Up Chakra UI

Chakra UI uses Emotion for handling component styles. So to get started with Chakra UI, you will need to install Chakra UI alongside Emotion as a peer dependency. For this project, we will be using the official Nuxt modules for both Chakra UI and Emotion which will reduce the friction in getting started with Chakra UI. Let’s add them to our project by running the following command:

npm i @chakra-ui/nuxt @nuxtjs/emotion

Note: @nuxtjs/emotion allows your component styles to be generated and injected in the server build.

After installing both modules, you will need to register them in the nuxt.config.js file under the modules array option:

// nuxt.config.js
modules: ['@chakra-ui/nuxt', '@nuxtjs/emotion'],

To complete our setup process of Chakra UI, we need to touch our default layout component in layouts/ and add CThemeProvider, CColorModeProvider, and CReset components from Chakra UI.

It is recommended thatyou use the CReset component to ensure all components provided by Chakra UI work correctly.

The CThemeProvider component will make your theme available to every part of your application, while the CColorModeProvider component is responsible for handling our application’s color mode which can be in one of two states: light or dark. Finally, the CReset component will remove all browser default styles.

Let’s add the aforementioned components in layouts/default.vue. In our template section, let’s add this:

<!-- layouts/default.vue -->
<template>
  <div class="container">
    <c-theme-provider>
      <c-color-mode-provider>
        <c-box as="section">
          <c-reset />
          <nuxt />
        </c-box>
      </c-color-mode-provider>
    </c-theme-provider>
  </div>
</template>

Then in our script section, we will import and register the components like so:

<script>
import { CThemeProvider, CColorModeProvider, CReset, CBox } from '@chakra-ui/vue'

export default {
  name: 'DefaultLayout',
  components: {
    CThemeProvider,
    CColorModeProvider,
    CReset,
    CBox
  }
}
</script>

Your default.vue layout component should look like this:

<template>
   <div class="container">
    <c-theme-provider>
      <c-color-mode-provider>
        <c-box as="section">
          <c-reset />
          <nuxt />
        </c-box>
      </c-color-mode-provider>
    </c-theme-provider>
  </div>
</template>

<script>
import { CThemeProvider, CColorModeProvider, CReset, CBox } from '@chakra-ui/vue'

export default {
  name: 'DefaultLayout',
  components: {
    CThemeProvider,
    CColorModeProvider,
    CReset,
    CBox
  }
}
</script>

Note: Notice I am wrapping both <c-reset /> and <nuxt /> components in a c-box component.

Setting Your Application Theme

Chakra UI allows you the ability to set a theme for your application. By ‘theme’, I mean the setting of your application’s color palette, type scale, font stacks, breakpoints, border-radius values, and so on. Since colors and contrast are vital components of accessibility, it’s important to use colors that are easily perceived.

Out of the box Chakra UI ships with a default theme object that affords for most of your application needs in terms of colors, fonts, and so on. The default theme is set up with contrast in mind which allows for the easily toggling of color modes (more on this later).

Chakra UI, however, allows you to extend or completely replaced the default theme. This is possible by accepting a theme object based on the Styled System Theme Specification.

The values in the theme object are automatically available for use in your application. For example, the colors specified in theme.colors can be referenced by the color, borderColor, backgroundColor, fill, stroke, and style props in your components.

To personalize your application, you can override the default theme provided by Chakra UI or set new values in it. To do that, the Chakra UI Nuxt module exposes a chakra object which will take in an extendTheme property which takes an object. The object given to extendTheme will be recursively merged to the Chakra UI default theme object. Let’s add our brand color palette to Chakra so we can use it in our application.

Note: Chakra UI recommends adding color palette into the colors object of your theme using keys from 50 — 900. You can use web tools like coolors and palx to generate these palettes.

For our demo homepage, I will be using a brand color of lime. To make Chakra UI aware of this color, I’ll create a customeTheme object in a folder called chakra(you can call it whatever you want) in the root of my project’s directory. In this object, I will define our brand color palette.

Create a file called theme.js in the folder you created and then add the following snippet:

// ./chakra/theme.js

const customTheme = {
  colors: {
    brand: {
      50: '#f6fcee',
      100: '#e2f4c8',
      200: '#cbec9e',
      300: '#b2e26e',
      400: '#94d736',
      500: '#75c800',
      600: '#68b300',
      700: '#599900',
      800: '#477900',
      900: '#294700'
    }
  }
}

module.exports = customTheme

Now let’s merge our custom theme to Chakra UI. We do that in nuxt.config.js. First, we need our custom theme object:

import customTheme from './chakra/theme'

Next, we have to specify the chakra key provided by the Chakra UI Nuxt module and pass in customTheme to the extendTheme property:

chakra: {
  extendTheme: customTheme
},

Your nuxt.config.js file should look like this:

// nuxt.config.js
import customTheme from './chakra/theme'

export default {
  mode: 'spa',
  /*
   * Headers of the page
   */
  head: {
    title: process.env.npm_package_name || '',
    meta: [
      { charset: 'utf-8' },
      { name: 'viewport', content: 'width=device-width, initial-scale=1' },
      {
        hid: 'description',
        name: 'description',
        content: process.env.npm_package_description || ''
      }
    ],
    link: [{ rel: 'icon', type: 'image/x-icon', href: '/favicon.ico' }]
  },
  /*
   * Customize the progress-bar color
   */
  loading: { color: '#fff' },
  /*
   * Global CSS
   */
  css: [],
  /*
   * Plugins to load before mounting the App
   */
  plugins: [],
  /*
   * Nuxt.js dev-modules
   */
  buildModules: [
    // Doc: https://github.com/nuxt-community/eslint-module
    '@nuxtjs/eslint-module'
  ],
  /*
   * Nuxt.js modules
   */
  modules: [
    '@chakra-ui/nuxt',
    '@nuxtjs/emotion'
  ],

  chakra: {
    extendTheme: customTheme
  },
  /*
   * Build configuration
   */
  build: {
    /*
     * You can extend webpack config here
     */
    extend (config, ctx) {}
  }
}

When you run your application with npm run dev, your homepage should look like this:

A demo application showing Chakra UI and NuxtJS
(Large preview)

Now that we have successfully installed Chakra UI and added our application’s custom theme, let’s begin building out Chakra-ui explorer.

Creating Our Main Navigation

We want our navigation to have our brand name, in this case, it will be Chakra-ui explorer, 2 navigation links: Documentation and Repo, and a button which is responsible for toggling our color mode. Let’s create a new component under the components directory called NavBar in which we’ll create our application’s main navigation using Chakra UI.

Let’s do this. Add the following snippet to NavBar.vue:

<template>
  <c-box
    as="nav"
    h="60px"
    px="4"
    d="flex"
    align-items="center"
    shadow="sm"
  >
    <c-link
      as="nuxt-link"
      to="/"
      color="brand.700"
      font-weight="bold"
      :_hover="{ color: 'brand.900' }"
    >
      Chakra-ui Explorer
    </c-link>

    <c-box
      as="ul"
      color="gray.500"
      d="flex"
      align-items="center"
      list-style-type="none"
      ml="auto"
    >
      <c-box as="li" mr="8">
        <c-link
          color="gray.500"
          :_hover="{ color: 'brand.400' }"
          is-external
          href="https://vue.chakra-ui.com"
        >
          Documentation
        </c-link>
      </c-box>
      <c-box as="li" mr="8">
        <c-link
          color="gray.500"
          :_hover="{ color: 'brand.400' }"
          is-external
          href="https://github.com/chakra-ui/chakra-ui-vue"
        >
          Repo
        </c-link>
      </c-box>
      <c-box as="li">
        <c-icon-button
          variant="ghost"
          variant-color="gray[900]"
          aria-label="Switch to dark mode"
          icon="moon"
        />
      </c-box>
    </c-box>
  </c-box>
</template>

<script>
import { CBox, CLink, CIconButton } from '@chakra-ui/vue'
export default {
  name: 'NavBar',
  components: {
    CBox,
    CLink,
    CIconButton
  }
}
</script>

Next, we need to import this component in our default layout component — default.vue and add it to our template so overall our default layout should look like this:

<template>
  <div class="container">
    <c-theme-provider>
      <c-color-mode-provider>
        <c-box as="section">
          <c-reset />
          <nav-bar />
          <nuxt />
        </c-box>
      </c-color-mode-provider>
    </c-theme-provider>
  </div>
</template>

<script>
import { CThemeProvider, CColorModeProvider, CReset, CBox } from '@chakra-ui/vue'
import NavBar from '@/components/NavBar'
export default {
  name: 'DefaultLayout',
  components: {
    CThemeProvider,
    CColorModeProvider,
    CReset,
    CBox,
    NavBar
  }
}
</script>

When you run your application now, you’ll get to see this:

You can see that the navigation is already accessible without even specifying it. This can only be seen when you hit the Tab key on your keyboard; Chakra UI handles focus management while you can focus on each link on the navigation menu.

The as Prop

From our NavBar.vue’s snippet above, you will notice the as prop. This is a feature available to Chakra UI components that allows you to pass an HTML tag or another component to be rendered as the base tag of the component along with all its styles and props. So when we did:

<c-box as="li">
      <c-icon-button
        variant="ghost"
        variant-color="gray[900]"
        aria-label="Switch to dark mode"
        icon="moon"
      />
</c-box>

we are asking Chakra UI to render an <li> element and place a button component inside it. You can also see us use that pattern here:

 <c-link 
     as="nuxt-link"
     to="/" 
     color="brand.700" 
     font-weight="bold" 
     :_hover="{ color : 'brand.900' }">
      ChakraMart
 </c-link>

In the above case, we are asking Chakra UI to render the Nuxt’s <nuxt-link /> component.

The as prop gives you the power to use the right(or wrong) element for the context of your markup. What this means, is you can leverage it to build your application template using semantic markups which will make your application more meaningful to screen readers. So instead of using a generic div element for the main content of your application, with the as prop you can render a main element telling screen readers that this is the main content of your application.

Note: Check out the documentation for all props exposed by Chakra UI components. Also, take a closer look at how the brand color in chakra/theme.js was specified. You can see from the snippet above that we’re using it as any of the colors that Chakra UI provides. Another thing to be aware of is the moon icon that we used for the CIconButton on our NavBar. The moon icon is one of the default icons that Chakra UI provides out of the box.

Color Mode

One of the features of Chakra UI is color mode support. And you can tell from the use of the moon icon in Chakra-ui explorer’s navigation, we plan on integrating dark mode. So instead of leaving it for last, let’s get it over with and wire it up right now. To do this, CColorModeProvider using Vue’s provide/inject, provides, $chakraColorMode and $toggleColorMode functions. $chakraColorMode returns the current color mode of your application while $toggleColorMode toggles the color mode from light to dark and vice versa. To use these two functions, we’ll need to inject them into the NavBar.vue component. Let’s do this below in the <script /> section:

<script>
<script>
import { CBox, CLink, CIconButton } from '@chakra-ui/vue'
export default {
  name: 'NavBar',
  inject: ['$chakraColorMode', '$toggleColorMode'],
  components: {
    CBox,
    CLink,
    CIconButton
  },
}
</script>

Let’s create a computed property to return the color mode:

...
 computed: {
    colorMode () {
      return this.$chakraColorMode()
    }
  }

Now that we have injected both functions in NavBar.vue let’s modify the toggle color mode button. We’ll start with the icon so that it shows a different icon depending on the color mode. Our CIconButton component now looks like this at this state:

<c-icon-button
  variant="ghost"
  variant-color="gray[900]"
  aria-label="Switch to dark mode"
  :icon="colorMode == 'light' ? 'moon' : 'sun'"
/>

Currently, we are using an aria-label attribute to tell screen-readers to Switch to dark mode. Let’s modify this to support both light and dark mode:

<c-icon-button
  variant="ghost"
  variant-color="gray[900]"
  :aria-label="`Switch to ${colorMode == 'light' ? 'dark : 'light'} mode`"
   :icon="colorMode == 'light' ? 'moon' : 'sun'"
/>

Lastly, we will add a click event handler on the button to toggle the color mode of our application using the $toggleColorMode function. Like so:

<c-icon-button
   variant="ghost"
   variant-color="gray[900]"
   :aria-label="`Switch to ${colorMode == 'light' ? 'dark' : 'light'} mode`"
   :icon="colorMode == 'light' ? 'moon' : 'sun'"
   @click="$toggleColorMode"
/>

To test if our color mode set up is working, I’ll add an interpolation of the color mode and a text next to the CIconButton toggling our color mode. Like so:

<c-box as="li">
  <c-icon-button
    variant="ghost"
    variant-color="gray[900]"
    :aria-label="`Switch to ${colorMode == 'light' ? 'dark' : 'light'} mode`"
    :icon="colorMode == 'light' ? 'moon' : 'sun'"
    @click="$toggleColorMode"
  />
  Current mode: {{ colorMode }}
</c-box>

Here is what our app currently looks like:

So we have done the heavy lifting in setting up color mode in Chakra UI. So now we can style our application based on the color mode. Let’s go to default.vue and use the color mode slot prop provided by CColorModeProvider to style our application. Let’s modify our template first in default.vue.

<template>
  <div class="container">
    <c-theme-provider>
      <c-color-mode-provider #default="{ colorMode }">
        <c-box
          v-bind="mainStyles[colorMode]"
          w="100vw"
          h="100vh"
          as="section"
        >
          <c-reset />
          <nav-bar />
          <nuxt />
        </c-box>
      </c-color-mode-provider>
    </c-theme-provider>
  </div>
</template>

We are destructuring colorMode from the slot props property provided by CColorModeProvider and then passing it as a dynamic key to a mainStyle object which we will create in a bit. The idea is to use a different set of styles based on the colorMode value. I am also using the width and height with the shorthand props — w and h respectively to set the width and height of our CBox component. Let’s define this mainStyles object in our script section:

<script>
import { CThemeProvider, CColorModeProvider, CReset, CBox } from '@chakra-ui/vue'
import NavBar from '@/components/NavBar'
export default {
  name: 'DefaultLayout',
  components: {
    CThemeProvider,
    CColorModeProvider,
    CReset,
    CBox,
    NavBar
  },
  data () {
    return {
      mainStyles: {
        dark: {
          bg: 'gray.900',
          color: 'whiteAlpha.900'
        },
        light: {
          bg: 'whiteAlpha.900',
          color: 'gray.900'
        }
      }
    }
  }
}
</script>

Chakra-ui explorer now has dark mode support!

Now we have our navigation bar and have successfully set up dark mode support for our application, let’s focus on index.vue in our pages/ directory where the meat of our application can be found. We’ll start off with adding a CBox component like so:

<c-box
  as="main"
  d="flex"
  direction="column"
  align-items="center"
  p="10" 
>
</c-box>

Then we’ll add the CInput component inside it. Our index.vue page component will then look like this:

<template>
  <c-box
    as="main"
    d="flex"
    align-items="center"
    direction="column"
    w="auto"
    p="16"
  >
    <c-input placeholder="Search components..." size="lg" mb="5" is-full-width />
  </c-box>
</template>

<script>
import { CBox, CInput } from '@chakra-ui/vue'
export default {
  components: {
    CBox,
    CInput
  }
}
</script>

Here is how our application looks like now:

You can see from the above screencast how the CInput element automatically knows when it’s in dark mode and adjust accordingly even though we didn’t explicitly set that. Also, the user can hit the tab key to focus on that CInput component.

Adding The Components’ List

So the idea of the Chakra-ui explorer (as stated earlier) is to show the user all of the available components in Chakra UI so that we can have a list of those components as well as the links that will take the user to the documentation of the component. To do this, I will create a folder called data at the root of our project’s directory then create a file called index.js. In index.js, I will export an array of objects which will contain the names of the components. Here is how the file should look like:

// ./data/index.js

export const components = [
  {
    name: 'Accordion'
  },
  {
    name: 'Alert'
  },
  {
    name: 'AlertDialog'
  },
  {
    name: 'AspectRatioBox'
  },
  {
    name: 'AspectRatioBox'
  },
  {
    name: 'Avatar'
  },
  {
    name: 'Badge'
  },
  {
    name: 'Box'
  },
  {
    name: 'Breadcrumb'
  },
  {
    name: 'Button'
  },
  {
    name: 'Checkbox'
  },
  {
    name: 'CircularProgress'
  },
  {
    name: 'CloseButton'
  },
  {
    name: 'Code'
  },
  {
    name: 'Collapse'
  },
  {
    name: 'ControlBox'
  },
  {
    name: 'Divider'
  },
  {
    name: 'Drawer'
  },
  {
    name: 'Editable'
  },
  {
    name: 'Flex'
  },
  {
    name: 'Grid'
  },
  {
    name: 'Heading'
  },
  {
    name: 'Icon'
  },
  {
    name: 'IconButton'
  },
  {
    name: 'IconButton'
  },
  {
    name: 'Input'
  },
  {
    name: 'Link'
  },
  {
    name: 'List'
  },
  {
    name: 'Menu'
  },
  {
    name: 'Modal'
  },
  {
    name: 'NumberInput'
  },
  {
    name: 'Popover'
  },
  {
    name: 'Progress'
  },
  {
    name: 'PseudoBox'
  },
  {
    name: 'Radio'
  },
  {
    name: 'SimpleGrid'
  },
  {
    name: 'Select'
  },
  {
    name: 'Slider'
  },
  {
    name: 'Spinner'
  },
  {
    name: 'Stat'
  },
  {
    name: 'Stack'
  },
  {
    name: 'Switch'
  },
  {
    name: 'Tabs'
  },
  {
    name: 'Tag'
  },
  {
    name: 'Text'
  },
  {
    name: 'Textarea'
  },
  {
    name: 'Toast'
  },
  {
    name: 'Tooltip'
  }
]

For our implementation to be complete, I will import the above array into pages/index.vue and iterate over it to display all the components. Also, we will give the user the ability to filter the components using the search box. Here is the complete implementation:

// pages/index.vue
<template>
  <c-box
    as="main"
    d="flex"
    align-items="space-between"
    flex-direction="column"
    w="auto"
    p="16"
  >
    <c-input v-model="search" placeholder="Search components..." size="lg" mb="10" is-full-width />
    <c-grid template-columns="repeat(4, 1fr)" gap="3" p="5">
      <c-box v-for="(chakraComponent, index) of filteredComponents" :key="index" h="10">
        {{ chakraComponent.name }}
  
      <c-badge>
          <c-link
            is-external
            :href="lowercase(`https://vue.chakra-ui.com/${chakraComponent.name}`)"
          >
            <c-icon name="info" size="18px" />
          </c-link>
        </c-badge>
      </c-box>
    </c-grid>
  </c-box>
</template>

<script>
import { CBox, CInput, CGrid, CLink, CBadge, CIcon } from '@chakra-ui/vue'
import { components as chakraComponents } from '../data'
export default {
  components: {
    CBox,
    CInput,
    CGrid,
    CBadge,
    CIcon,
    CLink
  },
  data () {
    return {
      search: ''
    }
  },
  computed: {
    filteredComponents () {
      return chakraComponents.filter((component) => {
        return this.lowercase(component.name).includes(this.lowercase(this.search))
      })
    }
  },
  methods: {
    lowercase (value) {
      return value.toLowerCase()
    }
  }
}
</script>

And now our application looks like this:

You can now see how dark mode is automatic for the component’s list as well as how the focus management is added for the links (by default) to aid accessibility.

Putting Chakra UI To The Test

Finally, let’s see how our app scores by running the Lighthouse accessibility test on it. Mind you, this test is based on the Axe user impact assessment. Below is a screencast of the test. You can also run the test yourself by following these steps.

From the screencast above you can see that our Chakra UI app has a score of 85 on the lighthouse accessibility test.

Conclusion

In this article, we have touched on the need for building accessible interfaces and we have also seen how to use Chakra UI to build accessible applications from the ground up by building an explorer (Chakra-ui explorer) for the Chakra UI components.

Smashing Editorial (ra, yk, il)

Creating Tiny Desktop Apps With Tauri And Vue.js

Creating Tiny Desktop Apps With Tauri And Vue.js

Creating Tiny Desktop Apps With Tauri And Vue.js

Kelvin Omereshone

Technology makes our lives better, not just users, but also creators (developers and designers). In this article, I’ll introduce you to Tauri. This article will be useful to you if:

  • you have been building applications on the web with HTML, CSS, and JavaScript, and you want to use the same technologies to create apps targeted at Windows, macOS, or Linux platforms;
  • you are already building cross-platform desktop apps with technologies like Electron, and you want to check out alternatives;
  • you want to build apps with web technologies for Linux distributions, such as PureOS;
  • you are a Rust enthusiast, and you’d like to apply it to build native cross-platform applications.

We will look at how to build a native cross-platform application from an existing web project. Let’s get to it!

Note: This article assumes you are comfortable with HTML, CSS, JavaScript, and Vue.js.

What Is Tauri?

The official website sums up Tauri well:

  • Tauri is a polyglot toolchain for building more secure native apps with both tiny and fast binaries. By “polyglot”, I mean that Tauri uses multiple programming languages. At the moment, Rust, JavaScript, and TypeScript are used. But there are plans to let you use Go, C++, Python, and more.
  • It lets you use any HTML and JavaScript-based front-end framework, such as Vue.js, React, or Angular, to build a native desktop app, and it can be integrated into any pipeline.
  • It helps you build and bundle binaries for major desktop platforms (mobile and WebAssembly coming soon).

So, basically, Tauri allows you to use web technologies to create tiny and secure native desktop apps.

On its GitHub page, Tauri is described as a framework-agnostic toolchain for building highly secure native apps that have tiny binaries (i.e. file size) and that are very fast (i.e. minimal RAM usage).

Why Not Electron?

A popular tool for using web technologies to build desktop applications is Electron.

However, Electron apps have a rather large bundle size, and they tend to take up a lot of memory when running. Here is how Tauri compares to Electron:

  • Bundle
    The size of a Tauri app can be less than 600 KB.
  • Memory
    The footprint of a Tauri app is less than half the size of an Electron app.
  • Licence
    Relicensing is possible with Tauri, but not with Electron. Electron ships with Chromium right out of the box. However, Chromium includes a digital rights-management system named Widevine. The inclusion of Widevine in Chromium makes apps created with Electron frowned upon by users of platforms such as PureOS for the sole reason that it is not free/libre open-source software (FLOSS). Platforms like PureOS are verified by the Free Software Foundation (FSF). This means that they can only publish free and open-source software in their app stores.

In a nutshell, if your app is built with Electron, it will never be shipped officially in the PureOS store. This should be a concern for developers targeting such distributions.

More Features Of Tauri

  • Security is really important to the Tauri team. Apps created with Tauri are meant to be secure from the get-go.
  • Tauri is compatible with any front-end framework, so you don’t have to change your stack.
  • It has many design patterns to help you choose important features with simple configurations.

Pros Of Tauri

  • Tauri enables you to take the code base you’ve built for the web and turn it into a native desktop app, without changing a thing.
  • Although you could use Rust in a Tauri-based project, it is completely optional. If you did, you wouldn’t need to change anything in your original code base targeted for the web.

Real-World Tauri

If you have been part of the Vue.js community for a while, then you’ll have heard of Guillaume Chau, a member of the core team of Vue.js. He is responsible for the Vue.js command-line interface (CLI), as well as other awesome Vue.js libraries. He recently created guijs, which stands for “graphical user interface for JavaScript projects”. It is a Tauri-powered native desktop app to visually manage your JavaScript projects.

Guijs is an example of what is possible with Tauri, and the fact that a core member of the Vue.js team works on the app tells us that Tauri plays nicely with Vue.js (amongst other front-end frameworks). Check out the guijs repository on GitHub if you are interested. And, yes, it is open-source.

How Tauri Works

At a high level, Tauri uses Node.js to scaffold an HTML, CSS, and JavaScript rendering window as a user interface (UI), managed and bootstrapped by Rust. The product is a monolithic binary that can be distributed as common file types for Linux (deb/appimage), macOS (app/dmg), and Windows (exe/msi).

How Tauri Apps Are Made

A Tauri app is created via the following steps:

  1. First, make an interface in your GUI framework, and prepare the HTML, CSS, and JavaScript for consumption.
  2. The Tauri Node.js CLI takes it and rigs the Rust runner according to your configuration.
  3. In development mode, it creates a WebView window, with debugging and Hot Module Reloading.
  4. In build mode, it rigs the bundler and creates a final application according to your settings.

Setting Up Your Environment

Now that you know what Tauri is and how it works, let me walk you through setting up your machine for development with Tauri.

Note: The setup here is for Linux machines, but guides for macOS and for Windows are also available.

Linux Setup

The polyglot nature of Tauri means that it requires a number of tool dependencies. Let’s kick it off by installing some of the dependencies. Run the following:

$ sudo apt update && sudo apt install libwebkit2gtk-4.0-dev build-essential curl libssl-dev appmenu-gtk3-module

Once the above is successful, proceed to install Node.js (if you don’t already have it), because Tauri requires its runtime. You can do so by running this:

curl -o- https://raw.githubusercontent.com/nvm-sh/nvm/v0.35.2/install.sh | bash

This will install nvm (Node.js version manager), which allows you to easily manage the Node.js runtime and easily switch between versions of Node.js. After it is installed, run this to see a list of Node.js versions:

nvm ls-remote

At the time of writing, the most recent version is 14.1.0. Install it like so:

nvm install v14.1.0

Once Node.js is fully set up, you would need to install the Rust compiler and the Rust package manager: Cargo. The command below would install both:

$ curl --proto '=https' --tlsv1.2 -sSf https://sh.rustup.rs | sh

After running this command, make sure that Cargo and Rust are in your $PATH by running the following:

rust --version

If everything has gone well, this should return a version number.

According to the Tauri documentation, make sure you are on the latest version by running the following command:

$ rustup update stable

Voilà! You are one step closer to getting your machine 100% ready for Tauri. All that’s left now is to install the tauri-bundler crate. It’s best to quit your CLI, and run the command below in a new CLI window:

$ cargo install tauri-bundler --force

Eureka! If everything went all right, your machine is now ready for Tauri. Next up, we will get started integrating Tauri with Vue.js. Let’s get to it!

Yarn

The Tauri team recommends installing the Yarn package manager. So let’s install it this way:

npm install -g yarn

Then run the following:

yarn --version

If everything worked, a version number should have been returned.

Integrating Tauri With Vue.js

Now that we have Tauri installed, let’s bundle an existing web project. You can find the live demo of the project on Netlify. Go ahead and fork the repository, which will serve as a shell. After forking it, make sure to clone the fork by running this:

git clone https://github.com/[yourUserName]/nota-web

After cloning the project, run the following to install the dependencies:

yarn

Then, run this:

yarn serve

Your application should be running on localhost:8080. Kill the running server, and let’s install the Vue.js CLI plugin for Tauri.

vue-cli-plugin-tauri

The Tauri team created a Vue.js CLI plugin that quickly rigs and turns your Vue.js single-page application (SPA) into a tiny cross-platform desktop app that is both fast and secure. Let’s install that plugin:

vue add tauri

After the plugin is installed, which might take a while, it will ask you for a window title. Just type in nota and press “Enter”.

Let’s examine the changes introduced by the Tauri plugin.

package.json

The Tauri plugin added two scripts in the scripts section of our package.json file. They are:

"tauri:build": "vue-cli-service tauri:build",
"tauri:serve": "vue-cli-service tauri:serve"

The tauri:serve script should be used during development. So let’s run it:

yarn tauri:serve

The above would download the Rust crates needed to start our app. After that, it will launch our app in development mode, where it will create a WebView window, with debugging and Hot Module Reloading!

src-tauri

You will also notice that the plugin added a src-tauri directory to the root of your app directory. Inside this directory are files and folders used by Tauri to configure your desktop app. Let’s check out the contents:

icons/
src/
    build.rs
    cmd.rs
    main.rs
Cargo.lock
Cargo.toml
rustfmt.toml
tauri.conf.json
tauri.js

The only change we would need to make is in src-tauri/Cargo.toml. Cargo.toml is like the package.json file for Rust. Find the line below in Cargo.toml:

name = "app"

Change it to this:

name = "nota"

That’s all we need to change for this example!

Bundling

To bundle nota for your current platform, simply run this:

yarn tauri:build

Note: As with the development window, the first time you run this, it will take some time to collect the Rust crates and build everything. On subsequent runs, it will only need to rebuild the Tauri crates themselves.

When the above is completed, you should have a binary of nota for your current OS. For me, I have a .deb binary created in the src-tauri/target/release/bundle/deb/ directory.*

Going Cross-Platform

You probably noticed that the yarn tauri:build command just generated a binary for your operating system. So, let’s generate the binaries for other operating systems. To achieve this, we will set up a workflow on GitHub. We are using GitHub here to serve as a distribution medium for our cross-platform app. So, your users could just download the binaries in the “Release” tab of the project. The workflow we would implement would automatically build our binaries for us via the power of GitHub actions. Let’s get to it.

Creating The Tauri Workflow

Thanks to Jacob Bolda, we have a workflow to automatically create and release cross-platform apps with Tauri on GitHub. Apart from building the binary for the various platforms (Linux, Mac, and Windows), the action would also upload the binary for you as a release on GitHub. It also uses the Create a Release action made by Jacob to achieve this.

To use this workflow, create a .github directory in the root of nota-web. In this directory, create another directory named workflows. We would then create a workflow file in .github/workflows/, and name it release-tauri-app.yml.

In release-tauri-app.yml, we would add a workflow that builds the binaries for Linux, macOS, and Windows. This workflow would also upload the binaries as a draft release on GitHub. The workflow would be triggered whenever we push to the master.

Open release-tauri-app.yml, and add the snippet below:

name: release-tauri-app

on:
  push:
    branches:
      - master
    paths:
      - '**/package.json'

jobs:
  check-build:
    runs-on: ubuntu-latest
    timeout-minutes: 30

    steps:
      — uses: actions/checkout@v2
      — name: setup node
        uses: actions/setup-node@v1
        with:
          node-version: 12
      — name: install rust stable
        uses: actions-rs/toolchain@v1
        with:
          toolchain: stable
          profile: minimal
      — name: install webkit2gtk
        run: |
          sudo apt-get update
          sudo apt-get install -y webkit2gtk-4.0
      — run: yarn
      — name: build nota for tauri app
        run: yarn build
      — run: cargo install tauri-bundler --force
      — name: build tauri app
        run: yarn tauri:build

  create-release:
    needs: check-build
    runs-on: ubuntu-latest
    outputs:
      RELEASE_UPLOAD_URL: ${{ steps.create_tauri_release.outputs.upload_url }}

    steps:
      — uses: actions/checkout@v2
      — name: setup node
        uses: actions/setup-node@v1
        with:
          node-version: 12
      — name: get version
        run: echo ::set-env name=PACKAGE_VERSION::$(node -p "require('./package.json').version")
      — name: create release
        id: create_tauri_release
        uses: jbolda/create-release@v1.1.0
        env:
          GITHUB_TOKEN: ${{ secrets.GITHUB_TOKEN }}
        with:
          tag_name: ${{ matrix.package.name }}-v${{ env.PACKAGE_VERSION }}
          release_name: 'Release nota app v${{ env.PACKAGE_VERSION }}'
          body: 'See the assets to download this version and install.'
          draft: true
          prerelease: false

  create-and-upload-assets:
    needs: create-release
    runs-on: ${{ matrix.platform }}
    timeout-minutes: 30

    strategy:
      fail-fast: false
      matrix:
        platform: [ubuntu-latest, macos-latest, windows-latest]
        include:
          — platform: ubuntu-latest
            buildFolder: bundle/deb
            ext: \_0.1.0_amd64.deb
            compressed: ''
          — platform: macos-latest
            buildFolder: bundle/osx
            ext: .app
            compressed: .tgz
          — platform: windows-latest
            buildFolder: ''
            ext: .x64.msi
            compressed: ''

    steps:
      — uses: actions/checkout@v2
      — name: setup node
        uses: actions/setup-node@v1
        with:
          node-version: 12
      — name: install rust stable
        uses: actions-rs/toolchain@v1
        with:
          toolchain: stable
          profile: minimal
      — name: install webkit2gtk (ubuntu only)
        if: matrix.platform == 'ubuntu-latest'
        run: |
          sudo apt-get update
          sudo apt-get install -y webkit2gtk-4.0
      — run: yarn
      — name: build nota for tauri app
        run: yarn build
      — run: cargo install tauri-bundler --force
      — name: build tauri app
        run: yarn tauri:build
      — name: compress (macos only)
        if: matrix.platform == 'macos-latest'
        working-directory: ${{ format('./src-tauri/target/release/{0}', matrix.buildFolder ) }}
        run: tar -czf ${{ format('nota{0}{1}', matrix.ext, matrix.compressed ) }} ${{ format('nota{0}', matrix.ext ) }}
      — name: upload release asset
        id: upload-release-asset
        uses: actions/upload-release-asset@v1.0.2
        env:
          GITHUB_TOKEN: ${{ secrets.GITHUB_TOKEN }}
        with:
          upload_url: ${{ needs.create-release.outputs.RELEASE_UPLOAD_URL }}
          asset_path: ${{ format('./src-tauri/target/release/{0}/nota{1}{2}', matrix.buildFolder, matrix.ext, matrix.compressed ) }}
          asset_name: ${{ format('nota{0}{1}', matrix.ext, matrix.compressed ) }}
          asset_content_type: application/zip
      — name: build tauri app in debug mode
        run: yarn tauri:build --debug
      — name: compress (macos only)
        if: matrix.platform == 'macos-latest'
        working-directory: ${{ format('./src-tauri/target/debug/{0}', matrix.buildFolder ) }}
        run: tar -czf ${{ format('nota{0}{1}', matrix.ext, matrix.compressed ) }} ${{ format('nota{0}', matrix.ext ) }}
      — name: upload release asset with debug mode on
        id: upload-release-asset-debug-mode
        uses: actions/upload-release-asset@v1.0.2
        env:
          GITHUB_TOKEN: ${{ secrets.GITHUB_TOKEN }}
        with:
          upload_url: ${{ needs.create-release.outputs.RELEASE_UPLOAD_URL }}
          asset_path: ${{ format('./src-tauri/target/debug/{0}/nota{1}{2}', matrix.buildFolder, matrix.ext, matrix.compressed ) }}
          asset_name: ${{ format('nota-debug{0}{1}', matrix.ext, matrix.compressed ) }}
          asset_content_type: application/zip

To test the workflow, commit and push your changes to your fork’s master branch. After successfully pushing to GitHub, you can then click on the “Actions” tab in GitHub, then click on the “Check build” link to see the progress of the workflow.

Upon successful execution of the action, you can see the draft release in “Releases” on the repository page on GitHub. You can then go on to publish your release!

Conclusion

This article has introduced a polyglot toolchain for building secure, cross-platform, and tiny native applications. We’ve seen what Tauri is and how to incorporate it with Vue.js. Lastly, we bundled our first Tauri app by running yarn tauri:build, and we also used a GitHub action to create binaries for Linux, macOS, and Windows.

Let me know what you think of Tauri — I’d be excited to see what you build with it. You can join the Discord server if you have any questions.

The repository for this article is on GitHub. Also, see the binaries generated by the GitHub workflow.

Smashing Editorial (ra, il, al)

Mirage JS Deep Dive: Using Mirage JS And Cypress For UI Testing (Part 4)

Mirage JS Deep Dive: Using Mirage JS And Cypress For UI Testing (Part 4)

Mirage JS Deep Dive: Using Mirage JS And Cypress For UI Testing (Part 4)

Kelvin Omereshone

One of my favorite quotes about software testing is from the Flutter documentation. It says:

“How can you ensure that your app continues to work as you add more features or change existing functionality? By writing tests.”

On that note, this last part of the Mirage JS Deep Dive series will focus on using Mirage to test your JavaScript front-end application.

Note: This article assumes a Cypress environment. Cypress is a testing framework for UI testing. You can, however, transfer the knowledge here to whatever UI testing environment or framework you use.

Read Previous Parts Of The Series:

  • Part 1: Understanding Mirage JS Models And Associations
  • Part 2: Understanding Factories, Fixtures And Serializers
  • Part 3: Understanding Timing, Response And Passthrough

UI Tests Primer

UI or User Interface test is a form of acceptance testing done to verify the user flows of your front-end application. The emphasis of these kinds of software tests is on the end-user that is the actual person who will be interacting with your web application on a variety of devices ranging from desktops, laptops to mobile devices. These users would be interfacing or interacting with your application using input devices such as a keyboard, mouse, or touch screens. UI tests, therefore, are written to mimic the user interaction with your application as close as possible.

Let’s take an e-commerce website for example. A typical UI test scenario would be:

  • The user can view the list of products when visiting the homepage.

Other UI test scenarios might be:

  • The user can see the name of a product on the product’s detail page.
  • The user can click on the “add to cart” button.
  • The user can checkout.

You get the idea, right?

In making UI Tests, you will mostly be relying on your back-end states, i.e. did it return the products or an error? The role Mirage plays in this is to make those server states available for you to tweak as you need. So instead of making an actual request to your production server in your UI tests, you make the request to Mirage mock server.

For the remaining part of this article, we will be performing UI tests on a fictitious e-commerce web application UI. So let’s get started.

Our First UI Test

As earlier stated, this article assumes a Cypress environment. Cypress makes testing UI on the web fast and easy. You could simulate clicks and navigation and you can programmatically visit routes in your application. See the docs for more on Cypress.

So, assuming Cypress and Mirage are available to us, let’s start off by defining a proxy function for your API request. We can do so in the support/index.js file of our Cypress setup. Just paste the following code in:

// cypress/support/index.js
Cypress.on("window:before:load", (win) => {
  win.handleFromCypress = function (request) {
    return fetch(request.url, {
      method: request.method,
      headers: request.requestHeaders,
      body: request.requestBody,
    }).then((res) => {
      let content =
        res.headers.map["content-type"] === "application/json"
          ? res.json()
          : res.text()
      return new Promise((resolve) => {
        content.then((body) => resolve([res.status, res.headers, body]))
      })
    })
  }
})

Then, in your app bootstrapping file (main.js for Vue, index.js for React), we’ll use Mirage to proxy your app’s API requests to the handleFromCypress function only when Cypress is running. Here is the code for that:

import { Server, Response } from "miragejs"

if (window.Cypress) {
  new Server({
    environment: "test",
    routes() {
      let methods = ["get", "put", "patch", "post", "delete"]
      methods.forEach((method) => {
        this[method]("/*", async (schema, request) => {
          let [status, headers, body] = await window.handleFromCypress(request)
          return new Response(status, headers, body)
        })
      })
    },
  })
}

With that setup, anytime Cypress is running, your app knows to use Mirage as the mock server for all API requests.

Let’s continue writing some UI tests. We’ll begin by testing our homepage to see if it has 5 products displayed. To do this in Cypress, we need to create a homepage.test.js file in the tests folder in the root of your project directory. Next, we’ll tell Cypress to do the following:

  • Visit the homepage i.e / route
  • Then assert if it has li elements with the class of product and also checks if they are 5 in numbers.

Here is the code:

// homepage.test.js
it('shows the products', () => {
  cy.visit('/');

  cy.get('li.product').should('have.length', 5);
});

You might have guessed that this test would fail because we don’t have a production server returning 5 products to our front-end application. So what do we do? We mock out the server in Mirage! If we bring in Mirage, it can intercept all network calls in our tests. Let’s do this below and start the Mirage server before each test in the beforeEach function and also shut it down in the afterEach function. The beforeEach and afterEach functions are both provided by Cypress and they were made available so you could run code before and after each test run in your test suite — hence the name. So let’s see the code for this:

// homepage.test.js
import { Server } from "miragejs"

let server

beforeEach(() => {
  server = new Server()
})

afterEach(() => {
  server.shutdown()
})

it("shows the products", function () {
  cy.visit("/")

  cy.get("li.product").should("have.length", 5)
})

Okay, we are getting somewhere; we have imported the Server from Mirage and we are starting it and shutting it down in beforeEach and afterEach functions respectively. Let’s go about mocking our product resource.


// homepage.test.js
import { Server, Model } from 'miragejs';

let server;

beforeEach(() => {
  server = new Server({
    models: {
      product: Model,
    },

    routes() {
      this.namespace = 'api';

      this.get('products', ({ products }, request) => {
        return products.all();
      });
    },
  });
});

afterEach(() => {
  server.shutdown();
});

it('shows the products', function() {
  cy.visit('/');

  cy.get('li.product').should('have.length', 5);
});

Note: You can always take a peek at the previous parts of this series if you don’t understand the Mirage bits of the above code snippet.

  • Part 1: Understanding Mirage JS Models And Associations
  • Part 2: Understanding Factories, Fixtures And Serializers
  • Part 3: Understanding Timing, Response And Passthrough

Okay, we have started fleshing out our Server instance by creating the product model and also by creating the route handler for the /api/products route. However, if we run our tests, it will fail because we don’t have any products in the Mirage database yet.

Let’s populate the Mirage database with some products. In order to do this, we could have used the create() method on our server instance, but creating 5 products by hand seems pretty tedious. There should be a better way.

Ah yes, there is. Let’s utilize factories (as explained in the second part of this series). We’ll need to create our product factory like so:

// homepage.test.js
import { Server, Model, Factory } from 'miragejs';

let server;

beforeEach(() => {
  server = new Server({
    models: {
      product: Model,
    },
     factories: {
      product: Factory.extend({
        name(i) {
            return `Product ${i}`
        }
      })
    },

    routes() {
      this.namespace = 'api';

      this.get('products', ({ products }, request) => {
        return products.all();
      });
    },
  });
});

afterEach(() => {
  server.shutdown();
});

it('shows the products', function() {
  cy.visit('/');

  cy.get('li.product').should('have.length', 5);
});

Then, finally, we’ll use createList() to quickly create the 5 products that our test needs to pass.

Let’s do this:

// homepage.test.js
import { Server, Model, Factory } from 'miragejs';

let server;

beforeEach(() => {
  server = new Server({
    models: {
      product: Model,
    },
     factories: {
      product: Factory.extend({
        name(i) {
            return `Product ${i}`
        }
      })
    },

    routes() {
      this.namespace = 'api';

      this.get('products', ({ products }, request) => {
        return products.all();
      });
    },
  });
});

afterEach(() => {
  server.shutdown();
});

it('shows the products', function() {
  server.createList("product", 5)
  cy.visit('/');

  cy.get('li.product').should('have.length', 5);
});

So when we run our test, it passes!

Note: After each test, Mirage’s server is shutdown and reset, so none of this state will leak across tests.

Avoiding Multiple Mirage Server

If you have been following along this series, you’d notice when we were using Mirage in development to intercept our network requests; we had a server.js file in the root of our app where we set up Mirage. In the spirit of DRY (Don’t Repeat Yourself), I think it would be good to utilize that server instance instead of having two separate instances of Mirage for both development and testing. To do this (in case you don’t have a server.js file already), just create one in your project src directory.

Note: Your structure will differ if you are using a JavaScript framework but the general idea is to setup up the server.js file in the src root of your project.

So with this new structure, we’ll export a function in server.js that is responsible for creating our Mirage server instance. Let’s do that:

// src/server.js

export function makeServer() { /* Mirage code goes here */}

Let’s complete the implementation of the makeServer function by removing the Mirage JS server we created in homepage.test.js and adding it to the makeServer function body:

import { Server, Model, Factory } from 'miragejs';

export function makeServer() {
  let server = new Server({
    models: {
      product: Model,
    },
    factories: {
      product: Factory.extend({
        name(i) {
          return `Product ${i}`;
        },
      }),
    },
    routes() {
      this.namespace = 'api';

      this.get('/products', ({ products }) => {
        return products.all();
      });
    },
    seeds(server) {
      server.createList('product', 5);
    },
  });
  return server;
}

Now all you have to do is import makeServer in your test. Using a single Mirage Server instance is cleaner; this way you don’t have to maintain two server instances for both development and test environments.

After importing the makeServer function, our test should now look like this:

import { makeServer } from '/path/to/server';

let server;

beforeEach(() => {
  server = makeServer();
});

afterEach(() => {
  server.shutdown();
});

it('shows the products', function() {
  server.createList('product', 5);

  cy.visit('/');

  cy.get('li.product').should('have.length', 5);
});

So we now have a central Mirage server that serves us in both development and testing. You can also use the makeServer function to start Mirage in development (see first part of this series).

Your Mirage code should not find it’s way into production. Therefore, depending on your build setup, you would need to only start Mirage during development mode.

Note: Read my article on how to set up API Mocking with Mirage and Vue.js to see how I did that in Vue so you could replicate in whatever front-end framework you use.

Testing Environment

Mirage has two environments: development (default) and test. In development mode, the Mirage server will have a default response time of 400ms(which you can customize. See the third article of this series for that), logs all server responses to the console, and loads the development seeds.

However, in the test environment, we have:

  • 0 delays to keep our tests fast
  • Mirage suppresses all logs so as not to pollute your CI logs
  • Mirage will also ignore the seeds() function so that your seed data can be used solely for development but won’t leak into your tests. This helps keep your tests deterministic.

Let’s update our makeServer so we can have the benefit of the test environment. To do that, we’ll make it accept an object with the environment option(we will default it to development and override it in our test). Our server.js should now look like this:

// src/server.js
import { Server, Model, Factory } from 'miragejs';

export function makeServer({ environment = 'development' } = {}) {
  let server = new Server({
    environment,

    models: {
      product: Model,
    },
    factories: {
      product: Factory.extend({
        name(i) {
          return `Product ${i}`;
        },
      }),
    },

    routes() {
      this.namespace = 'api';

      this.get('/products', ({ products }) => {
        return products.all();
      });
    },
    seeds(server) {
      server.createList('product', 5);
    },
  });
  return server;
}

Also note that we are passing the environment option to the Mirage server instance using the ES6 property shorthand. Now with this in place, let’s update our test to override the environment value to test. Our test now looks like this:

import { makeServer } from '/path/to/server';

let server;

beforeEach(() => {
  server = makeServer({ environment: 'test' });
});

afterEach(() => {
  server.shutdown();
});

it('shows the products', function() {
  server.createList('product', 5);

  cy.visit('/');

  cy.get('li.product').should('have.length', 5);
});

AAA Testing

Mirage encourages a standard for testing called the triple-A or AAA testing approach. This stands for Arrange, Act and Assert. You could see this structure in our above test already:

it("shows all the products", function () {
  // ARRANGE
  server.createList("product", 5)

  // ACT
  cy.visit("/")

  // ASSERT
  cy.get("li.product").should("have.length", 5)
})

You might need to break this pattern but 9 times out of 10 it should work just fine for your tests.

Let’s Test Errors

So far, we’ve tested our homepage to see if it has 5 products, however, what if the server is down or something went wrong with fetching the products? We don’t need to wait for the server to be down to work on how our UI would look like in such a case. We can simply simulate that scenario with Mirage.

Let’s return a 500 (Server error) when the user is on the homepage. As we have seen in a previous article, to customize Mirage responses we make use of the Response class. Let’s import it and write our test.

homepage.test.js
import { Response } from "miragejs"

it('shows an error when fetching products fails', function() {
  server.get('/products', () => {
    return new Response(
      500,
      {},
      { error: "Can’t fetch products at this time" }
    );
  });

  cy.visit('/');

  cy.get('div.error').should('contain', "Can’t fetch products at this time");
});

What a world of flexibility! We just override the response Mirage would return in order to test how our UI would display if it failed fetching products. Our overall homepage.test.js file would now look like this:

// homepage.test.js
import { Response } from 'miragejs';
import { makeServer } from 'path/to/server';

let server;

beforeEach(() => {
  server = makeServer({ environment: 'test' });
});

afterEach(() => {
  server.shutdown();
});

it('shows the products', function() {
  server.createList('product', 5);

  cy.visit('/');

  cy.get('li.product').should('have.length', 5);
});

it('shows an error when fetching products fails', function() {
  server.get('/products', () => {
    return new Response(
      500,
      {},
      { error: "Can’t fetch products at this time" }
    );
  });

  cy.visit('/');

  cy.get('div.error').should('contain', "Can’t fetch products at this time");
});

Note the modification we did to the /api/products handler only lives in our test. That means it works as we previously define when you are in development mode.

So when we run our tests, both should pass.

Note: I believe its worthy of noting that the elements we are querying for in Cypress should exist in your front-end UI. Cypress doesn’t create HTML elements for you.

Testing The Product Detail Page

Finally, let’s test the UI of the product detail page. So this is what we are testing for:

  • User can see the product name on the product detail page

Let’s get to it. First, we create a new test to test this user flow.

Here is the test:

it("shows the product’s name on the detail route", function() {
  let product = this.server.create('product', {
    name: 'Korg Piano',
  });

  cy.visit(`/${product.id}`);

  cy.get('h1').should('contain', 'Korg Piano');
});

Your homepage.test.js should finally look like this.

// homepage.test.js
import { Response } from 'miragejs';
import { makeServer } from 'path/to/server;

let server;

beforeEach(() => {
  server = makeServer({ environment: 'test' });
});

afterEach(() => {
  server.shutdown();
});

it('shows the products', function() {
  console.log(server);
  server.createList('product', 5);

  cy.visit('/');

  cy.get('li.product').should('have.length', 5);
});

it('shows an error when fetching products fails', function() {
  server.get('/products', () => {
    return new Response(
      500,
      {},
      { error: "Can’t fetch products at this time" }
    );
  });

  cy.visit('/');

  cy.get('div.error').should('contain', "Can’t fetch products at this time");
});

it("shows the product’s name on the detail route", function() {
  let product = server.create('product', {
    name: 'Korg Piano',
  });

  cy.visit(`/${product.id}`);

  cy.get('h1').should('contain', 'Korg Piano');
});

When you run your tests, all three should pass.

Wrapping Up

It’s been fun showing you the inners of Mirage JS in this series. I hope you have been better equipped to start having a better front-end development experience by using Mirage to mock out your back-end server. I also hope you’ll use the knowledge from this article to write more acceptance/UI/end-to-end tests for your front-end applications.

  • Part 1: Understanding Mirage JS Models And Associations
  • Part 2: Understanding Factories, Fixtures And Serializers
  • Part 3: Understanding Timing, Response And Passthrough
  • Part 4: Using Mirage JS And Cypress For UI Testing
Smashing Editorial (ra, il)

Mirage JS Deep Dive: Understanding Timing, Response And Passthrough (Part 3)

Mirage JS Deep Dive: Understanding Timing, Response And Passthrough (Part 3)

Mirage JS Deep Dive: Understanding Timing, Response And Passthrough (Part 3)

Kelvin Omereshone

Mirage JS was built to give frontend developers the ability to simulate actual backend API calls. So far, we have seen how we can create records with Mirage, intercept API requests via route handlers and, last but not least, how the shape of the data returned to us from Mirage is affected.

In this part of the series, we will see Mirage mechanism for simulating other aspects of an actual backend server like slow network, HTTP status code response, and also making requests to an actual backend even though Mirage is intercepting your frontend requests.

Let’s begin by simulating slow network requests.

Timing

When developing your frontend application that relies on a backend API, it’s useful to see how your application behaves under slow networks (think about testing loading messages and loaders). This test is important because requests to backend API are asynchronous in nature. What this means is that we can’t make assumptions about when we will get the response so we need to write our code as if it might come immediately, or there might be a delay.

A common reason for a delay in response is a slow Internet connection. It is then really important to know how your app would behave in such circumstances. Mirage caters to this need by making available a timing option which is a property passed to a route handler that tells the handler to wait for a particular duration specified by the timing option (in milliseconds) before returning a response whenever the route it is handling is called.

Note: By default, Mirage is setting a 400ms delay for the server during development and 0 during testing so your tests can run faster (no one really enjoys slow tests).

We now know in theory how to customize Mirage’s server response time. Let’s see a couple of ways to tweak that response time via the timing option.

timing On routes()

As earlier stated, Mirage sets a default delay for the server response time to be 400ms during development and 0 for tests. You could override this default on the routes method on the Server instance.

In the example below, I am setting the timing option to 1000ms in the routes method to artificially set the response delay for all routes:

import { Server } from 'miragejs'

new Server({
    routes() {
        this.routes = 1000
    }
})

The above tells Mirage to wait for 1000 milliseconds before returning a response. So if your front-end make a request to a route handler like the one below:

this.get('/users', (schema) => {
    return schema.users.all();
});

Mirage will take 1000 milliseconds to respond.

Tip: Instead of directly using the schema object, you could use ES 6 object restructuring to make your route handler cleaner and shorter like below:

this.get('/users', ({ users }) => {
    return users.all()
}

timing For Individual Routes

Although the this.timing property is useful, in some scenarios you wouldn’t want to delay all your routes. Because of this scenario, Mirage gives you the ability to set the timing option in a config options object you could pass at the end of a route handler. Taking our above code snippets, let’s pass the 1000ms response delay to the route itself as opposed to globally setting it:

this.get('/users', ({ users }) => {
  return users.all();
 }, { timing: 1000 });

The result is the same as globally assigning the timing. But now you have the ability to specify different timing delays for individual routes. You could also set a global timing with this.timing and then override it in a route handler. Like so:

this.timing = 1000

this.get('users', ( { users } ) => {
    return users.all()
})

this.get('/users/:id', ({ users }, request) => {
    let { id } = request.params;
     return users.find(id);
 }, { timing: 500 });

So now when we make a request to /users/1, it will return the below user JSON in half of the time (500ms) it would take for every other route.

{
  "user": {
    "name": "Kelvin Omereshone",
    "age": 23,
    "id": "1"
  }
}

Passthrough

Route handlers are the Mirage mechanism for intercepting requests your frontend application makes. By default, Mirage will throw an error similar to the one below when your app makes a request to an endpoint that you haven’t defined a Route handler for in your server instance.

Error: Mirage: Your app tried to GET '/unknown', but there was no route defined to handle this request. Define a route for this endpoint in your routes() config. Did you forget to define a namespace?

You can, however, tell Mirage that if it sees a request to a route that you didn’t define a route handler for, it should allow that request to go through. This is useful if you have an actual backend and you want to use Mirage to test out endpoints that haven’t been implemented yet in your backend. To do this, you would need to make a call to the passthrough method inside the routes methods in your Mirage server instance.

Let’s see it in code:

import { Server } from 'miragejs'

new Server({
    routes() {
        // you can define your route handlers above the passthrough call
        this.passthrough()
    }
})

Note: It is recommended keeping the call to passthrough at the bottom in order to give your route handlers precedence.

Now when Mirage sees requests to a route that you didn’t define in Mirage, it would let them “passthrough”. I really find this useful because it makes Mirage play nicely with an actual backend. So a scenario would be, you are ahead of your backend team and you want to make a request to an endpoint that you don’t have in your production backend, you could just mock out that endpoint in mirage and because of the passthrough option, you wouldn’t need to worry about other parts of your app making requests failing.

Using passthrough To Whitelist Route

passthrough takes in options to allow you to have more control over routes you want to whitelist. So as opposed to calling passthrough without any option and allowing routes not present in mirage to passthrough, you can pass in one or more strings of the routes you want to whitelist to passthrough. So if we want to whitelist /reviews and /pets we can do that using passthrough like so:

this.passthrough('/reviews', '/pets)

You can also do multiple calls to passthrough:

this.passthrough('/reviews')
this.passthrough('/pets')

Note: I find passing multiple route strings to passthrough cleaner as opposed to making multiple calls. But you are free to use whatever feels natural to you.

Using passthrough On A Set Of HTTP Verbs

The above passthrough we defined will allow all HTTP verbs (GET, POST, PATCH, DELETE) to passthrough. If your use case requires you to allow a subset of the HTTP verbs to passthrough, Mirage provides an options array on the passthrough method wherein you pass the verbs you want Mirage to whitelist on a particular route. Let’s see it in code:

// this allows post requests to the /reviews route to passthrough
this.passthrough('/reviews', ['post']);

You could also pass multiple strings of routes as well as the HTTP verbs array like so:

// this allows post and patch requests to /reviews and /pets routes to passthrough

this.passthrough('/pets', 'reviews', ['post', 'patch'])

Response

Now you see the level of customization Mirage gives you with both the timing option and passthrough method, it feels only natural for you to know how to customize the HTTP status code Mirage sends for the requests you make. By default, Mirage would return a status of 200 which says everything went fine. (Check out this article for a refresher on HTTP status code.) Mirage, however, provides the Response class which you can use to customize the HTTP status code as well as other HTTP headers to be sent back to your frontend application.

The Response class gives you more control over your route handler. You can pass in the following to the Response class constructor:

  • The HTTP status code,
  • HTTP Headers,
  • Data (a JSON payload to be returned to the frontend).

To see how the Response class works, we would start on an easy note by rewriting our previous route handler using the Response class. So we would take the below route handler:

this.get('users', ( { users } ) => {
return users.all()
})

and then reimplement using the Response class. To do this we first need to import the Response class from Mirage:

import { Response } from 'miragejs'

We would then rewrite our route handler using the Response class:

this.get('/users', ({ users }) => {
    return new Response(200, {}, users.all());
});

Note: We are passing an empty {} to the header argument because we are do not want to set any header values for this response.

I believe we can infer that Mirage under the hood uses the Response class when we previously returned users.all() because both implementations would act the same way and return the same JSON payload.

I will admit the above use of Response is a little bit verbose because we are not doing anything special yet. However, the Response class holds a world of possibility to allows you to simulate different server states and set headers.

Setting Server States

With the Response class, you can now simulate different server states via the status code which is the first argument the Response constructor takes. You can now pass in 400 to simulate a bad request, 201 to simulate the created state when you create a new resource in Mirage, and so on. With that in mind, let’s customize /users/:id route handler and pass in 404 to simulate that a user with the particular ID was not found.

this.get('/users/:id', (schema, request) => {
   let { id } = request.params;
   return new Response(404, {}, { error: 'User with id ${id} not found'});
});

Mirage would then return a 404 status code with the error message similar to the below JSON payload:

{
  "error": "User with id 5 not found"
}

Setting Headers

With the Response class, you can set response headers by passing an object as the second argument to the Response constructor. With this flexibility, you can simulate setting any headers you want. Still using our /users/:id route, we can set headers like so:

this.get('/users/:id', (schema, request) => {
     let { id } = request.params;
     return new Response(404, {"Content-Type" : "application/json", author: 'Kelvin Omereshone' }, { error: `User with id ${id} not found`});
});

Now when you check Mirage logs in your browser console, you would see the headers we set.

Wrapping Up

In this part of the Mirage JS Deep Dive series, I have expounded three mechanisms that Mirage exposes to its users in order to simulate a real server. I look forward to seeing you use Mirage better with the help of this article.

Stay tuned for the next and final part of the series coming up next week!

  • Part 1: Understanding Mirage JS Models And Associations
  • Part 2: Understanding Factories, Fixtures And Serializers
  • Part 3: Understanding Timing, Response And Passthrough
Smashing Editorial (ra, il)

Mirage JS Deep Dive: Understanding Factories, Fixtures And Serializers (Part 2)

Mirage JS Deep Dive: Understanding Factories, Fixtures And Serializers (Part 2)

Mirage JS Deep Dive: Understanding Factories, Fixtures And Serializers (Part 2)

Kelvin Omereshone

In the previous article of this series, we understudied Models and Associations as they relate to Mirage. I explained that Models allow us to create dynamic mock data that Mirage would serve to our application when it makes a request to our mock endpoints. In this article, we will look at three other Mirage features that allow for even more rapid API mocking. Let’s dive right in!

Note: I highly recommend reading my first two articles if you haven’t to get a really solid handle on what would be discussed here. You could however still follow along and reference the previous articles when necessary.

Factories

In a previous article, I explained how Mirage JS is used to mock backend API, now let’s assume we are mocking a product resource in Mirage. To achieve this, we would create a route handler which will be responsible for intercepting requests to a particular endpoint, and in this case, the endpoint is api/products. The route handler we create will return all products. Below is the code to achieve this in Mirage:

import { Server, Model } from 'miragejs';

new Server({
    models: {
      product: Model,
    },

   routes() {
        this.namespace = "api";
        this.get('products', (schema, request) => {
        return schema.products.all()
    })
   }
});
    },

The output of the above would be:

{
  "products": []
}

We see from the output above that the product resource is empty. This is however expected as we haven’t created any records yet.

Pro Tip: Mirage provides shorthand needed for conventional API endpoints. So the route handler above could also be as short as: this.get('/products').

Let’s create records of the product model to be stored in Mirage database using the seeds method on our Server instance:

 seeds(server) {
      server.create('product', { name: 'Gemini Jacket' })
      server.create('product', { name: 'Hansel Jeans' })
  },

The output:

{
  "products": [
    {
      "name": "Gemini Jacket",
      "id": "1"
    },
    {
      "name": "Hansel Jeans",
      "id": "2"
    }
  ]
}

As you can see above, when our frontend application makes a request to /api/products, it will get back a collection of products as defined in the seeds method.

Using the seeds method to seed Mirage’s database is a step from having to manually create each entry as an object. However, it wouldn’t be practical to create 1000(or a million) new product records using the above pattern. Hence the need for factories.

Factories Explained

Factories are a faster way to create new database records. They allow us to quickly create multiple records of a particular model with variations to be stored in the Mirage JS database.

Factories are also objects that make it easy to generate realistic-looking data without having to seed those data individually. Factories are more of recipes or blueprints for creating records off models.

Creating A Factory

Let’s examine a Factory by creating one. The factory we would create will be used as a blueprint for creating new products in our Mirage JS database.

import { Factory } from 'miragejs'

new Server({
    // including the model definition for a better understanding of what’s going on
    models: {
        product: Model
    },
    factories: {
        product: Factory.extend({})
    }
})

From the above, you’d see we added a factories property to our Server instance and define another property inside it that by convention is of the same name as the model we want to create a factory for, in this case, that model is the product model. The above snippet depicts the pattern you would follow when creating factories in Mirage JS.

Although we have a factory for the product model, we really haven’t added properties to it. The properties of a factory can be simple types like strings, booleans or numbers, or functions that return dynamic data as we would see in the full implementation of our new product factory below:

import { Server, Model, Factory } from 'miragejs'

new Server({
    models: {
        product: Model
    },

   factories: {
      product: Factory.extend({
        name(i) {
          //  i is the index of the record which will be auto incremented by Mirage JS
          return `Awesome Product ${i}`; // Awesome Product 1, Awesome Product 2, etc.
        },
        price() {
          let minPrice = 20;
          let maxPrice = 2000;
          let randomPrice =
            Math.floor(Math.random() * (maxPrice - minPrice + 1)) + minPrice;
          return `$ ${randomPrice}`;
        },
        category() {
          let categories = [
            'Electronics',
            'Computing',
            'Fashion',
            'Gaming',
            'Baby Products',
          ];
          let randomCategoryIndex = Math.floor(
            Math.random() * categories.length
          );
          let randomCategory = categories[randomCategoryIndex];
          return randomCategory;
        },
         rating() {
          let minRating = 0
          let maxRating = 5
          return Math.floor(Math.random() * (maxRating - minRating + 1)) + minRating;
        },
      }),
    },
})

In the above code snippet, we are specifying some javascript logic via Math.random to create dynamic data each time the factory is used to create a new product record. This shows the strength and flexibility of Factories.

Let’s create a product utilizing the factory we defined above. To do that, we call server.create and pass in the model name (product) as a string. Mirage will then create a new record of a product using the product factory we defined. The code you need in order to do that is the following:

new Server({
    seeds(server) {
        server.create("product")
    }
})

Pro Tip: You can run console.log(server.db.dump()) to see the records in Mirage’s database.

A new record similar to the one below was created and stored in the Mirage database.

{
  "products": [
    {
      "rating": 3,
      "category": "Computing",
      "price": "$739",
      "name": "Awesome Product 0",
      "id": "1"
    }
  ]
}

Overriding factories

We can override some or more of the values provided by a factory by explicitly passing them in like so:

server.create("product", {name: "Yet Another Product", rating: 5, category: "Fashion" })

The resulting record would be similar to:

{
  "products": [
    {
      "rating": 5,
      "category": "Fashion",
      "price": "$782",
      "name": "Yet Another Product",
      "id": "1"
    }
  ]
}

createList

With a factory in place, we can use another method on the server object called createList. This method allows for the creation of multiple records of a particular model by passing in the model name and the number of records you want to be created. Below is it’s usage:

server.createList("product", 10)

Or

server.createList("product", 1000)

As you’ll observe, the createList method above takes two arguments: the model name as a string and a non-zero positive integer representing the number of records to create. So from the above, we just created 500 records of products! This pattern is useful for UI testing as you’ll see in a future article of this series.

Fixtures

In software testing, a test fixture or fixture is a state of a set or collection of objects that serve as a baseline for running tests. The main purpose of a fixture is to ensure that the test environment is well known in order to make results repeatable.

Mirage allows you to create fixtures and use them to seed your database with initial data.

Note: It is recommended you use factories 9 out of 10 times though as they make your mocks more maintainable.

Creating A Fixture

Let’s create a simple fixture to load data onto our database:

 fixtures: {
      products: [
        { id: 1, name: 'T-shirts' },
        { id: 2, name: 'Work Jeans' },
      ],
  },

The above data is automatically loaded into the database as Mirage’s initial data. However, if you have a seeds function defined, Mirage would ignore your fixture with the assumptions that you meant for it to be overridden and instead use factories to seed your data.

Fixtures In Conjunction With Factories

Mirage makes provision for you to use Fixtures alongside Factories. You can achieve this by calling server.loadFixtures(). For example:

 fixtures: {
    products: [
      { id: 1, name: "iPhone 7" },
      { id: 2, name: "Smart TV" },
      { id: 3, name: "Pressing Iron" },
    ],
  },

  seeds(server) {
    // Permits both fixtures and factories to live side by side
    server.loadFixtures()

    server.create("product")
  },

Fixture files

Ideally, you would want to create your fixtures in a separate file from server.js and import it. For example you can create a directory called fixtures and in it create products.js. In products.js add:

// <PROJECT-ROOT>/fixtures/products.js
export default [
  { id: 1, name: 'iPhone 7' },
  { id: 2, name: 'Smart TV' },
  { id: 3, name: 'Pressing Iron' },
];

Then in server.js import and use the products fixture like so:

import products from './fixtures/products';
 fixtures: {
    products,
 },

I am using ES6 property shorthand in order to assign the products array imported to the products property of the fixtures object.

It is worthy of mention that fixtures would be ignored by Mirage JS during tests except you explicitly tell it not to by using server.loadFixtures()

Factories vs. Fixtures

In my opinion, you should abstain from using fixtures except you have a particular use case where they are more suitable than factories. Fixtures tend to be more verbose while factories are quicker and involve fewer keystrokes.

Serializers

It’s important to return a JSON payload that is expected to the frontend hence serializers.

A serializer is an object that is responsible for transforming a **Model** or **Collection** that’s returned from your route handlers into a JSON payload that’s formatted the way your frontend app expects.

Mirage Docs

Let’s take this route handler for example:

this.get('products/:id', (schema, request) => {
        return schema.products.find(request.params.id);
      });

A Serializer is responsible for transforming the response to something like this:

{
  "product": {
    "rating": 0,
    "category": "Baby Products",
    "price": "$654",
    "name": "Awesome Product 1",
    "id": "2"
  }
}

Mirage JS Built-in Serializers

To work with Mirage JS serializers, you’d have to choose which built-in serializer to start with. This decision would be influenced by the type of JSON your backend would eventually send to your front-end application. Mirage comes included with the following serializers:

  • JSONAPISerializer
    This serializer follows the JSON:API spec.
  • ActiveModelSerializer
    This serializer is intended to mimic APIs that resemble Rails APIs built with the active_model_serializer gem.
  • RestSerializer
    The RestSerializer is Mirage JS “catch all” serializer for other common APIs.

Serializer Definition

To define a serialize, import the appropriate serializer e.g RestSerializer from miragejs like so:

import { Server, RestSerializer } from "miragejs"

Then in the Server instance:

new Server({
  serializers: {
    application: RestSerializer,
  },
})

The RestSerializer is used by Mirage JS by default. So it’s redundant to explicitly set it. The above snippet is for exemplary purposes.

Let’s see the output of both JSONAPISerializer and ActiveModelSerializer on the same route handler as we defined above

JSONAPISerializer

import { Server, JSONAPISerializer } from "miragejs"
new Server({
  serializers: {
    application: JSONAPISerializer,
  },
})

The output:

{
  "data": {
    "type": "products",
    "id": "2",
    "attributes": {
      "rating": 3,
      "category": "Electronics",
      "price": "$1711",
      "name": "Awesome Product 1"
    }
  }
}

ActiveModelSerializer

To see the ActiveModelSerializer at work, I would modify the declaration of category in the products factory to:

productCategory() {
          let categories = [
            'Electronics',
            'Computing',
            'Fashion',
            'Gaming',
            'Baby Products',
          ];
          let randomCategoryIndex = Math.floor(
            Math.random() * categories.length
          );
          let randomCategory = categories[randomCategoryIndex];
          return randomCategory;
        },

All I did was to change the name of the property to productCategory to show how the serializer would handle it.

Then, we define the ActiveModelSerializer serializer like so:

import { Server, ActiveModelSerializer } from "miragejs"
new Server({
  serializers: {
    application: ActiveModelSerializer,
  },
})

The serializer transforms the JSON returned as:

{
  "rating": 2,
  "product_category": "Computing",
  "price": "$64",
  "name": "Awesome Product 4",
  "id": "5"
}

You’ll notice that productCategory has been transformed to product_category which conforms to the active_model_serializer gem of the Ruby ecosystem.

Customizing Serializers

Mirage provides the ability to customize a serializer. Let’s say your application requires your attribute names to be camelcased, you can override RestSerializer to achieve that. We would be utilizing the lodash utility library:

import { RestSerializer } from 'miragejs';
import { camelCase, upperFirst } from 'lodash';
serializers: {
      application: RestSerializer.extend({
        keyForAttribute(attr) {
          return upperFirst(camelCase(attr));
        },
      }),
    },

This should produce JSON of the form:

 {
      "Rating": 5,
      "ProductCategory": "Fashion",
      "Price": "$1386",
      "Name": "Awesome Product 4",
      "Id": "5"
    }

Wrapping Up

You made it! Hopefully, you’ve got a deeper understanding of Mirage via this article and you’ve also seen how utilizing factories, fixtures, and serializers would enable you to create more production-like API mocks with Mirage. Look out for the next part of this series.

Smashing Editorial (ra, il)

Understanding Machines: An Open Standard For JavaScript Functions

Understanding Machines: An Open Standard For JavaScript Functions

Understanding Machines: An Open Standard For JavaScript Functions

Kelvin Omereshone

As developers, we always seek ways to do our job better, whether by following patterns, using well-written libraries and frameworks, or what have you. In this article, I’ll share with you a JavaScript specification for easily consumable functions. This article is intended for JavaScript developers, and you’ll learn how to write JavaScript functions with a universal API that makes it easy for those functions to be consumed. This would be particularly helpful for authoring npm packages (as we will see by the end of this article).

There is no special prerequisite for this article. If you can write a JavaScript function, then you’ll be able to follow along. With all that said, let’s dive in.

What Are Machines?

Machines are self-documenting and predictable JavaScript functions that follow the machine specification, written by Mike McNeil. A machine is characterized by the following:

  • It must have one clear purpose, whether it’s to send an email, issue a JSON Web Token, make a fetch request, etc.
  • It must follow the specification, which makes machines predictable for consumption via npm installations.

As an example, here is a collection of machines that provides simple and consistent APIs for working with Cloudinary. This collection exposes functions (machines) for uploading images, deleting images, and more. That’s all that machines are really: They just expose a simple and consistent API for working with JavaScript and Node.js functions.

Features of Machines

  • Machines are self-documenting. This means you can just look at a machine and knows what it’s doing and what it will run (the parameters). This feature really sold me on them. All machines are self-documenting, making them predictable.
  • Machines are quick to implement, as we will see. Using the machinepack tool for the command-line interface (CLI), we can quickly scaffold a machine and publish it to npm.
  • Machines are easy to debug. This is also because every machine has a standardized API. We can easily debug machines because they are predictable.

Are There Machines Out There?

You might be thinking, “If machines are so good, then why haven’t I heard about them until now?” In fact, they are already widely used. If you’ve used the Node.js MVC framework Sails.js, then you have either written a machine or interfaced with a couple. The author of Sails.js is also the author of the machine specification.

In addition to the Sails.js framework, you could browse available machines on npm by searching for machinepack, or head over to http://node-machine.org/machinepacks, which is machinepack’s registry daemon; it syncs with npm and updates every 10 minutes.

Machines are universal. As a package consumer, you will know what to expect. So, no more trying to guess the API of a particular package you’ve installed. If it’s a machine, then you can expect it to follow the same easy-to-use interface.

Now that we have a handle on what machines are, let’s look into the specification by analyzing a sample machine.

The Machine Specification

    module.exports = {
  friendlyName: 'Do something',
  description: 'Do something with the provided inputs that results in one of the exit scenarios.',
  extendedDescription: 'This optional extended description can be used to communicate caveats, technical notes, or any other sort of additional information which might be helpful for users of this machine.',
  moreInfoUrl: 'https://stripe.com/docs/api#list_cards',
  sideEffects: 'cacheable',
  sync: true,

  inputs: {
    brand: {
      friendlyName: 'Some input',
      description: 'The brand of gummy worms.',
      extendedDescription: 'The provided value will be matched against all known gummy worm brands. The match is case-insensitive, and tolerant of typos within Levenstein edit distance <= 2 (if ambiguous, prefers whichever brand comes first alphabetically).',
      moreInfoUrl: 'http://gummy-worms.org/common-brands?countries=all',
      required: true,
      example: 'haribo',
      whereToGet: {
        url: 'http://gummy-worms.org/how-to-check-your-brand',
        description: 'Look at the giant branding on the front of the package. Copy and paste with your brain.',
        extendedDescription: 'If you don\'t have a package of gummy worms handy, this probably isn\'t the machine for you. Check out the `order()` machine in this pack.'
      }
    }
  },

  exits: {
    success: {
      outputFriendlyName: 'Protein (g)',
      outputDescription: 'The grams of gelatin-based protein in a 1kg serving.',
    },
    unrecognizedFlavors: {
      description: 'Could not recognize one or more of the provided `flavorStrings`.',
      extendedDescription: 'Some **markdown**.',
      moreInfoUrl: 'http://gummyworms.com/flavors',
    }
  },

  fn: function(inputs, exits) {
    // ...
    // your code here
    var result = 'foo';
    // ...
    // ...and when you're done:
    return exits.success(result);
  };
}

The snippet above is taken from the interactive example on the official website. Let’s dissect this machine.

From looking at the snippet above, we can see that a machine is an exported object containing certain standardized properties and a single function. Let’s first see what those properties are and why they are that way.

  • friendlyName
    This is a display name for the machine, and it follows these rules:
    • is sentence-case (like a normal sentence),
    • must not have ending punctuation,
    • must be fewer than 50 characters.
  • description
    This should be a clear one-sentence description in the imperative mood (i.e. the authoritative voice) of what the machine does. An example would be “Issue a JSON Web Token”, rather than “Issues a JSON Web Token”. Its only constraint is:
    • It should be fewer than 80 characters.
  • extendedDescription (optional)
    This property provides optional supplemental information, extending what was already said in the description property. In this field, you may use punctuation and complete sentences.
    • It should be fewer than 2000 characters.
  • moreInfoUrl (optional)
    This field contains a URL in which additional information about the inner workings or functionality of the machine can be found. This is particularly helpful for machines that communicate with third-party APIs such as GitHub and Auth0.
  • sideEffects (optional)
    This is an optional field that you can either omit or set as cacheable or idempotent. If set to cacheable, then .cache() can be used with this machine. Note that only machines that do not have sideEffects should be set to cacheable.
  • sync (optional)
    Machines are asynchronous by default. Setting the sync option to true turns off async for that machine, and you can then use it as a regular function (without async/await, or then()).

inputs

This is the specification or declaration of the values that the machine function expects. Let’s look at the different fields of a machine’s input.

  • brand
    Using the machine snippet above as our guide, the brand field is called the input key. It is normally camel-cased, and it must be an alphanumeric string starting with a lowercase letter.
    • No special characters are allowed in an input key identifier or field.
  • friendlyName
    This is a human-readable display name for the input. It should:
    • be sentence-case,
    • have no ending punctuation,
    • be fewer than 50 characters.
  • description
    This is a short description describing the input’s use.
  • extendedDescription
    Just like the extendedDescription field on the machine itself, this field provides supplemental information about this particular input.
  • moreInfoUrl
    This is an optional URL that provides more information about the input, if needed.
  • required
    By default, every input is optional. What that means is that if, by runtime, no value is provided for an input, then the fn would be undefined. If your inputs are not optional, then it’s best to set this field as true because this would make the machine throw an error.
  • example
    This field is used to determined the expected data type of the input.
  • whereToGet
    This is an optional documentation object that provides additional information on how to locate adequate values for this input. This is particularly useful for things like API keys, tokens, and so on.
  • whereToGet.description
    This is a clear one-sentence description, also in the imperative mood, that describes how to find the right value for this input.
  • extendedDescription
    This provides additional information on where to get a suitable input value for this machine.

exits

This is the specification for all possible exit callbacks that this machine’s fn implementation can trigger. This implies that each exit represents one possible outcome of the machine’s execution.

  • success
    This is the standardized exit key in the machine specification that signifies that everything went well and the machine worked without any errors. Let’s look at the properties it could expose:
    • outputFriendlyName
      This is simply a display name for the exit output.
    • outputDescription
      This short noun phrase describes the output of an exit.

Other exits signify that something went wrong and that the machine encountered an error. The naming convention for such exits should follow the naming convention for the input’s key. Let’s see the fields under such exits:

  • description
    This is a short description describing when the exit would be called.
  • extendedDescription
    This provides additional information about when this exit would be called. It’s optional. You may use full Markdown syntax in this field, and as usual, it should be fewer than 2000 characters.

You Made It!

That was a lot to take in. But don’t worry: When you start authoring machines, these conventions will stick, especially after your first machine, which we will write together shortly. But first…

Machinepacks

When authoring machines, machinepacks are what you publish on npm. They are simply sets of related utilities for performing common, repetitive development tasks with Node.js. So let’s say you have a machinepack that works with arrays; it would be a bundle of machines that works on arrays, like concat(), map(), etc. See the Arrays machinepack in the registry to get a full view.

Machinepacks Naming Convention

All machinepacks must follow the standard of having “machinepack-” as a prefix, followed by the name of the machine. For example, machinepack-array, machinepack-sessionauth.

Our First Machinepack

To better understand machines, we will write and publish a machinepack that is a wrapper for the file-contributors npm package.

Getting Started

We require the following to craft our machinepack:

  1. Machinepack CLI tool
    You can get it by running:
    npm install -g machinepack
    
  2. Yeoman scaffolding tool
    Install it globally by running:
     npm install -g yo
    
  3. Machinepack Yeomen generator
    Install it like so:
    npm install -g generator-machinepack
    

Note: I am assuming that Node.js and npm are already installed on your machine.

Generating Your First Machinepack

Using the CLI tools that we installed above, let’s generate a new machinepack using the machinepack generator. Do this by first going into the directory that you want the generator to generate the files in, and then run the following:

yo machinepack

The command above will start an interactive process of generating a barebones machinepack for you. It will ask you a couple of questions; be sure to say yes to it creating an example machine.

Note: I noticed that the Yeoman generator has some issues when using Node.js 12 or 13. So, I recommend using nvm, and install Node.js 10.x, which is the environment that worked for me.

If everything has gone as planned, then we would have generated the base layer of our machinepack. Let’s take a peek:

DELETE_THIS_FILE.md
machines/
package.json
package.lock.json
README.md
index.js
node_modules/

The above are the files generated for you. Let’s play with our example machine, found inside the machines directory. Because we have the machinepack CLI tool installed, we could run the following:

machinepack ls

This would list the available machines in our machines directory. Currently, there is one, the say-hello machine. Let’s find out what say-hello does by running this:

machinepack exec say-hello

This will prompt you for a name to enter, and it will print the output of the say-hello machine.

As you’ll notice, the CLI tool is leveraging the standardization of machines to get the machine’s description and functionality. Pretty neat!

Let’s Make A Machine

Let’s add our own machine, which will wrap the file-contributors and node-fetch packages (we will also need to install those with npm). So, run this:

npm install file-contributors node-fetch --save

Then, add a new machine by running:

machinepack add

You will be prompted to fill in the friendly name, the description (optional), and the extended description (also optional) for the machine. After that, you will have successfully generated your machine.

Now, let’s flesh out the functionality of this machine. Open the new machine that you generated in your editor. Then, require the file-contributors package, like so:

const fetch = require('node-fetch');
const getFileContributors = require('file-contributors').default;

global.fetch = fetch; // workaround since file-contributors uses windows.fetch() internally

Note: We are using node-fetch package and the global.fetch = fetch workaround because the file-contributors package uses windows.fetch() internally, which is not available in Node.js.

The file-contributors’ getFileContributors requires three parameters to work: owner (the owner of the repository), repo (the repository), and path (the path to the file). So, if you’ve been following along, then you’ll know that these would go in our inputs key. Let’s add these now:

...
 inputs: {
    owner: {
      friendlyName: 'Owner',
      description: 'The owner of the repository',
      required: true,
      example: 'DominusKelvin'
    },
    repo: {
      friendlyName: 'Repository',
      description: 'The Github repository',
      required: true,
      example: 'machinepack-filecontributors'
    },
    path: {
      friendlyName: 'Path',
      description: 'The relative path to the file',
      required: true,
      example: 'README.md'
    }
  },
...

Now, let’s add the exits. Originally, the CLI added a success exit for us. We would modify this and then add another exit in case things don’t go as planned.

exits: {

    success: {
      outputFriendlyName: 'File Contributors',
      outputDescription: 'An array of the contributors on a particular file',
      variableName: 'fileContributors',
      description: 'Done.',
    },

    error: {
      description: 'An error occurred trying to get file contributors'
    }

  },

Finally let’s craft the meat of the machine, which is the fn:

 fn: function(inputs, exits) {
    const contributors = getFileContributors(inputs.owner, inputs.repo, inputs.path)
    .then(contributors => {
      return exits.success(contributors)
    }).catch((error) => {
      return exits.error(error)
    })
  },

And voilà! We have crafted our first machine. Let’s try it out using the CLI by running the following:

machinepack exec get-file-contributors

A prompt would appear asking for owner, repo, and path, successively. If everything has gone as planned, then our machine will exit with success, and we will see an array of the contributors for the repository file we’ve specified.

Usage In Code

I know we won’t be using the CLI for consuming the machinepack in our code base. So, below is a snippet of how we’d consume machines from a machinepack:

    var FileContributors = require('machinepack-filecontributors');

// Fetch metadata about a repository on GitHub.
FileContributors.getFileContributors({
  owner: 'DominusKelvin',
  repo: 'vue-cli-plugin-chakra-ui',
   path: 'README.md' 
}).exec({
  // An unexpected error occurred.
  error: function (){
  },
  // OK.
  success: function (contributors){
    console.log('Got:\n', contributors);
  },
});

Conclusion

Congratulations! You’ve just become familiar with the machine specification, created your own machine, and seen how to consume machines. I’ll be glad to see the machines you create.

Resources

Check out the repository for this article. The npm package we created is also available on npm.

Smashing Editorial (ra, il, al)

Mirage JS Deep Dive: Understanding Mirage JS Models And Associations (Part 1)

Mirage JS Deep Dive: Understanding Mirage JS Models And Associations (Part 1)

Mirage JS Deep Dive: Understanding Mirage JS Models And Associations (Part 1)

Kelvin Omereshone

Mirage JS is helping simplify modern front-end development by providing the ability for front-end engineers to craft applications without relying on an actual back-end service. In this article, I’ll be taking a framework-agnostic approach to show you Mirage JS models and associations. If you haven’t heard of Mirage JS, you can read my previous article in which I introduce it and also integrate it with the progressive framework Vue.js.

Note: These deep-dive series are framework agnostic, meaning that we would be looking at Mirage JS itself and not the integration into any front-end framework.

Models

Mirage JS borrowed some terms and concepts which are very much familiar to back-end developers, however, since the library would be used mostly by front-end teams, it’s appropriate to learn what these terms and concepts are. Let’s get started with what models are.

What Are Models?

Models are classes that define the properties of a particular data to be stored in a database. For example, if we have a user model, we would define the properties of a user for our application such as name, email, and so on. So each time we want to create a new user, we use the user model we’ve defined.

Creating models In Mirage JS

Though Mirage JS would allow you mockup data manually, using the Mirage Model class would give you a whole lot of awesome development experience because you’d have at your fingertips, data persistence.

Models wrap your database and allow you to create relationships that are really useful for returning different collections of data to your app.

Mirage uses an in-memory database to store entries you make using its model. Also without models, you won’t have access to associations which we would look at in a bit.

So, in order to create a model in Mirage JS first of, you have to import the Model class from Mirage JS like so:

import { Server, Model } from ‘miragejs’

Then, in our ‘Server’ options we use it as the following:

let server = new Server({
  models: {
    user: Model,
  }

Note: If you don’t know what Mirage JS server is, it’s how Mirage JS intercepts network requests. I explained it in detail in my previous article.

From the above, you could see we are creating a user model instance. Doing so allows us to persist entries for the said model.

Creating Entries

To create new entries for our user model, you need to use the schema class like so:

let user = schema.users.create({name: “Harry Potter”})

Note: Mirage JS automatically pluralize your models to form the schema. You could also see we are not explicitly describing before-hand, the properties the user model instance would have. This approach makes for the rapid creation of entries and flexibility in adding fields for the said entries.

You’d most likely be creating instances of your model in the seeds() method of your server instance, so in that scenario you’d create a new user instance using the create() method of the server object like so:

let server = new Server({
  models: {
    user: Model
  },

  seeds(server) {
    server.create("user", { name: "Harry Potter" });
});

In the above code, I redundantly added the snippet for both the server and model creation as to establish some context.

To see a full working Mirage JS server see my previous article on the same subject or check this repo.

Accessing Properties And Relationships

You could access the properties or fields of a model instance using dot notation. So if we want to create a new user instance for the user model, then use this:

let user = schema.users.create({name: “Hermione Granger”})

We can also access the name of the user simply by using the following:

user.name
// Hermione Granger

Furthermore, if the instance created has a relationship called ‘posts’ for example, we can access that by using:

user.posts
// Returns all posts belonging to the user 

Finding An Instance

Let’s say you’ve created three instances of the user model and you want to find the first one you could simply use the schema on that model like so:

let firstUser = schema.users.find(1)
// Returns the first user

More Model Instance Properties

Mirage exposes a couple of useful properties on model instances. Let’s take a closer look at them.

associations

You could get the associations of a particular instance by using the associations property.

let harry = schema.users.create({name: “Harry Potter”})
user.associations
// would return associations of this instance if any

According to the Mirage JS docs, the above would return a hash of relationships belonging to that instance.

attrs

We can also get all the fields or attributes of a particular instance by using the attrs property of a model instance like so:

harry.attrs
// { name: “Harry Potter” }

Methods

destroy()

This method removes the instances it is called on from Mirage JS database.

harry.destroy()

isNew()

This method returns true if the model has not been persisted yet to the database. Using the create method of the schema would always save an instance to Mirage JS database so isNew() would always return false. However, if you use the new method to create a new instance and you haven’t called save() on it, isNew() would return true.

Here’s an example:

let ron = schema.users.new({name: “Ronald Weasley”})

ron.isNew()

// true

ron.save()

ron.isNew()

// false

isSaved()

This is quite the opposite of the isNew() method. You could use it to check if an instance has been saved into the database. It returns true if the instance has been saved or false if it hasn’t been saved.

reload()

This method reloads an instance from Mirage Js database. Note it works only if that instance has been saved in the database. It’s useful to get the actual attributes in the database and their values if you have previously changed any. For example:

let headmaster = schema.users.create({name: “Albus Dumbledore”})

headmaster.attrs
// {id: 1, name: “Albus Dumbledore”}

headmaster.name = “Severus Snape”

headmaster.name
// Severus Snape

headmaster.reload()

headmaster.name

// Albus Dumbledore

save()

This method does what it says which is, it saves or creates a new record in the database. You’d only need to use it if you created an instance without using the create() method. Let’s see it in action.

let headmaster = schema.users.new({name: “Albus Dumbledore”})

headmaster.id
// null

headmaster.save()

headmaster.name = “Severus Snape”
// Database has not yet been updated to reflect the new name

headmaster.save()
// database has been updated

headmaster.name

// Severus Snape

toString()

This method returns a simple string representation of the model and id of that particular instance. Using our above headmaster instance of the user model, when we call:

headmaster.toString()

We get:

// “model:user:1”

update()

This method updates a particular instance in the database. An example would be:

let headmaster = schema.users.find(1)
headmaster.update(“name”, “Rubeus Harris”)

Note: The update() takes two arguments. The first is the key which is a string and the second argument is the new value you want to update it as.

Associations

Since we’ve now been well acquainted with Models and how we use them in Mirage JS, let’s look at it’s counterpart — associations.

Associations are simply relationships between your models. The relationship could be one-to-one or one-to-many.

Associations are very common in backend development they are powerful for getting a model and its related models, for example, let’s say we want a user and all his posts, associations are utilized in such scenarios. Let’s see how we set that up in Mirage JS.

Once you’ve defined your models, you can create relationships between them using Mirage JS association helpers

Mirage has the following associations helpers

  • hasMany()
    use for defining to-many relationships
  • belongsTo()
    use for defining to-one relationships

When you use either of the above helpers, Mirage JS injects some useful properties and methods in the model instance. Let’s look at a typical scenario of posts, authors, and comments. It could be inferred that a particular author can have more than one blog post also, a particular post can have comments associated with it. So let’s see how we can mock out these relationships with Mirage JS association helpers:

belongsTo()

Import Helpers

First import the belongsTo

import { Server, Model, belongsTo } from 'miragejs'

Next we create our models and use the extend method to add our relationships like so

new Server({
  models: {
    post: Model.extend({
      author: belongsTo(),
    }),

    author: Model,
  },
})

The above defines a to-one relationship from the post model to an author model. Doing so, the belongsTo helper adds several properties and methods to the affected models. Hence we can now do the following:

post.authorId // returns the author id of the post
post.author // Author instance
post.author = anotherAuthor
post.newAuthor(attrs) // creates a new author without saving to database
post.createAuthor(attrs) // creates a new author and save to database

hasMany()

This helper like its belongsTo counterpart needs to be imported from Mirage JS before use, so:

import { Server, Model, hasMany } from 'miragejs'

Then we can go on creating our to-many relationships:

  models: {
    post: Model.extend({
      comments: hasMany(),
    }),

    comment: Model,
  },
})

Like belongsTo(), hasMany() helper also adds several properties and method automatically to the affected models:

post.commentIds // [1, 2, 3]
post.commentIds = [2, 3] // updates the relationship
post.comments // array of related comments
post.comments = [comment1, comment2] // updates the relationship
post.newComment(attrs) // new unsaved comment
post.createComment(attrs) // new saved comment (comment.postId is set)

The above snippet is adapted from the well written Mirage JS documentation

Conclusion

Mirage JS is set out to make mocking our back-end a breeze in modern front-end development. In this first part of the series, we looked at models and associations/relationships and how to utilize them in Mirage JS. Stay tuned for the next parts!

Smashing Editorial (dm, ra, il)

Setting Up API Mocking With Mirage JS And Vue.js

Setting Up API Mocking With Mirage JS And Vue.js

Setting Up API Mocking With Mirage JS And Vue.js

Kelvin Omereshone

In the era of SPA and the JAMstack, there has always been a separation of concern between the APIs and front-end development. Almost all JavaScript projects that can be found out in the wild interact with a web service or API and either use it for authentications or getting user-related data.

So, whenever you’re working on a project and the necessary API still hasn’t been implemented by the back-end team or you need to quickly test a feature, you have some of the following options:

  • You could proxy to a locally running version of your actual backend which, in most cases as a front-end developer, you wouldn’t have.
  • You could comment out actual request and replace with mock data. (This is okay but not so great as you would need to undo that to get to production and you might not be able to deal with network states and latency.)

What Is API Mocking?

API mocking is an imitation or a simulation of an actual API. It is mostly done in order to intercept requests that are supposed to be made to an actual backend API but this mocking exist on your frontend.

Why is API Mocking Important

API mocking is significantly important in a lot of ways:

  1. It makes for a very good front-end development experience not to depend on production APIs before building out features.
  2. You could share your entire frontend and it would work without depending on an actual backend API.

What Is Mirage JS?

Mirage JS was created 5 years ago and was pretty much used in the Ember community before Sam Selikoff officially announced its release on the 24th of January, 2020 on Twitter.

Mirage JS solves the pain point for testing backend APIs without depending on those APIs. It allows for seamless front-end development experience by mocking production APIs.

Mirage JS is an API mocking library for Vue.js, React, Angular and Ember frameworks

What Makes Mirage JS A Better Choice?

There have been other options for API mocking (such as Axios interceptors, Typicode’s JSON server, and so on) but what I think is pretty interesting about Mirage is that it doesn’t get in the way of your development process (as you would see when we set it up with Vue in a bit). It is lightweight and yet powerful.

It comes with battery included out of the box that allows you to replicate real production API consumption scenarios like simulating a slow network with its timing option.

Getting Started With Mirage JS And Vue.js

So now that you know what Mirage JS is and why it’s important to your front-end development workflow, let’s look at setting it up with the progressive web framework: Vue.js.

Creating A Green-Field (Clean Installation) Vue Project

Using the Vue CLI, create a fresh Vue.js project by going into the directory you want the project to be created in and running (in your terminal):

vue create miragejs-demo-vue 

The above command would set up a new Vue project which you can now cd into and run either yarn serve or npm run serve.

#Installing Mirage JS

Now let’s install Mirage JS as a development dependency in our Vue.js project by running the following command:

yarn add -D miragejs

Or if you are using NPM, run this:

npm install --save-dev miragejs

And that’s it! Mirage JS is now installed in our Vue.js project.

Let’s Mock Out Something

With Mirage JS installed, let’s see how we configure it to talk to Vue and mock out a basic todos (an API that returns a list of todos) API.

Define Your Server

To get started, we need to create a server.js file in the /src directory of our Vue.js project. After that, add the following:

import { Server, Model } from 'miragejs'

export function makeServer({ environment = "development" } = {}) {

let server = new Server({
  environment,

    models: {
      todo: Model,
    },

  seeds(server) {
  server.create("todo", { content: "Learn Mirage JS" })
  server.create("todo", { content: "Integrate With Vue.js" })
  },

  routes() {

    this.namespace = "api"

    this.get("/todos", schema => {
      return schema.todos.all()
    })
    
  },
  })

  return server
}

Code Explained

Firstly, the server.js file is how you set up Mirage JS to create a new instance of it’s mock (fake) server which will intercept all API calls you make in your app matching the routes that you define.

Now, I agree the above may be overwhelming at first, but let’s take a closer look at what’s going on here:

import { Server, Model } from 'miragejs'

From the above code snippet, we are importing Server and Model from miragejs.

  • Server
    This is a class exposed by Mirage to helps us instantiate a new instance of a Mirage JS server to “serve” as our fake server.
  • Model
    Another class exposed by Mirage to help in creating models(a model determines the structure of a Mirage JS database entry) powered by Mirage’s ORM.
export function makeServer({ environment = "development" } = {}) {}

The above basically export a function called makeServer from the src/server.js. You could also note we are passing in an environment parameter and setting Mirage’s environment mode to development (you would see us passing test environment later on in this article).

The Body Of makeServer

Now we are doing a couple of things in the makeServer body. Let’s take a look:

let server = new Server({})

We are instantiating a new instance of the Server class and passing it a configuration option. The content of the configuration options help set up mirage:

{
  environment,

  models: {
    todo: Model,
  },

  seeds(server) {
  server.create("todo", { content: "Learn Mirage JS" })
  server.create("todo", { content: "Integrate With Vue.js" })
  },

  routes() {

    this.namespace = "api"

    this.get("/todos", schema => {
      return schema.todos.all()
    })
  },
  
  }

Firstly we are passing the environment parameter we initialized in the function definition.

models: {
    todo: Model,
  },

The next option which is the models option takes an object of the different models we want Mirage to mock.

In the above, we simply want a todo model which we are instantiating from the Model class.

seeds(server) {
server.create("todo", { content: "Learn Mirage JS" })
server.create("todo", { content: "Integrate With Vue.js" })
},

The next option is the seeds method which takes in a parameter called server. The seeds method helps create seeds(seeds are initial data or an entry into Mirage’s database) for our models. In our case to create the seeds for the todo model we do:

server.create("todo", { content: "Learn Mirage JS" })
server.create("todo", { content: "Integrate With Vue.js" })

so the server has a create method which expects as the first argument a string which corresponds to the name of the model, then an object which will contain the properties or attributes of a particular seed.

routes() {

    this.namespace = "api"

    this.get("/todos", schema => {
      return schema.todos.all()
    })
  },

finally, we have the routes method which defines the various route(routes are our mock API endpoints) Mirage JS is going to mock. Let’s look at the body of the method:

this.namespace = "api"

this line sets up the namespace for all routes that means our todo route can now be accessed from /api/todos.

this.get("/todos", schema => {
  return schema.todos.all()
})

The above creates a get route and it’s handler using the this.get() method. The get() method expects the route i.e “/todos” and a handler function that takes in schema as an argument. The schema object is how you interact with Mirage’s ORM which is powered by Mirage JS in-memory database.

Finally:

return schema.todos.all()

We are returning a list of all our todos, using the schema object made possible by Mirage’s ORM.

src/main.js

So we are done setting up src/server.js but Vue doesn’t know about it(at least not yet). So let’s import it in our main.js file like so:

import { makeServer } from "./server"

Then we call the makeServer function like so:

if (process.env.NODE_ENV === "development") {
  makeServer()
}

The above if conditional is a guard to make sure mirage only runs in development.

Set up Complete!

Now we’ve set up Miragejs with Vue. Let’s see it in action. In our App.vue file, we would clear out the content and replace with the below snippet:

<template>
  <ul id="todos">
    <li v-for="todo in todos" v-bind:key="todo.id">{{ todo.content }}</li>
  </ul>
</template>

<script>
  export default {
    name: 'app',

    data() {
      return {
        todos: []
      }
    },

    created() {
      fetch("/api/todos")
        .then(res => res.json())
        .then(json => {
          this.todos = json.todos
        })
    }
  }
</script>

If you are familiar with Vue.js, the above would be nothing new but for the sake of being total, what we are doing is making an API request using fetch when our App.vue component is created, then we pass in the returned data to the todos array in our component state. Afterward, we are using a v-for to iterate the todos array and displaying the content property of each todo.

Where Is The Mirage JS Part?

If you notice, in our App.vue component, we didn’t do anything specific to Mirage, we are just making an API call as we would normally do. This feature of Mirage is really great for DX cause under the hood, Mirage would intercept any requests that match any of the routes defined in src/server.js while you are in development.

This is pretty handy cause no work would be needed in your part to switch to an actual production server when you are in a production environment provided the routes match your production API endpoints.

So restart your Vue dev server via yarn serve to test Mirage JS.

You should see a list of two todos. One thing you’d find pretty interesting is that we did not need to run a terminal command to start up Mirage because it removes that overhead by running as a part of your Vue.js application.

Mirage JS And Vue test-utils

If you are already using Vue Test-utils in your Vue application, you’d find it exciting to know that Mirage can easily work with it to mock network requests. Let’s see an example set up using our todos application.

We would be using Jest for our unit-testing. So if you are following along, you could pretty much use the Vue CLI to install the @vue/unit-jest plugin like so:

vue add @vue/unit-jest

The above will install @vue/cli-plugin-unit-jest and @vue/test-utils development dependencies while also creating a tests directory and a jest.config.js file. It will also add the following command in our package.json scripts section (pretty neat):

"test:unit": "vue-cli-service test:unit"

Let’s Test!

We would update our App.vue to look like this:

<!-- src/App.vue -->
<template>
  <div v-if="serverError" data-testid="server-error">
    {{ serverError }}
  </div>

  <div v-else-if="todos.length === 0" data-testid="no-todos">
    No todos!
  </div>

  <div v-else>
    <ul id="todos">
      <li
        v-for="todo in todos"
        v-bind:key="todo.id"
        :data-testid="'todo-' + todo.id"
      >
        {{ todo.content }}
      </li>
    </ul>
  </div>
</template>

<script>
  export default {
    name: "app",

    data() {
      return {
        todos: [],
        serverError: null,
      }
    },

    created() {
      fetch("/api/todos")
        .then(res => res.json())
        .then(json => {
          if (json.error) {
            this.serverError = json.error
          } else {
            this.todos = json.todos
          }
        })
    },
  }
</script>

Nothing really epic is going on in the above snippet; we are just structuring to allow for the network testing we would be implementing with our unit test.

Although Vue CLI has already added a /tests folder for us, I find it to be a much better experience when my tests are placed close to the components they are testing. So create a /__tests__ folder in src/ and create an App.spec.js file inside it. (This is also the recommended approach by Jest.)

// src/__tests__/App.spec.js
import { mount } from "@vue/test-utils"
import { makeServer } from "../server"
import App from "../App.vue"

let server

beforeEach(() => {
  server = makeServer({ environment: "test" })
})

afterEach(() => {
  server.shutdown()
})

So to set up our unit testing, we are importing the mount method from @vue/test-utils, importing the Miragejs server we created earlier and finally importing the App.vue component.

Next, we are using the beforeEach life cycle function to start the Mirage JS server while passing in the test environment. (Remember, we set by default the environment to be development.)

Lastly, we are shutting down the server using server.shutdown in the afterEach lifecycle method.

Our Tests

Now let’s flesh out our test (we would be adopting the quickstart section of the Mirage js docs. So your App.spec.js would finally look like this:

// src/__tests__/App.spec.js

import { mount } from "@vue/test-utils"
import { makeServer } from "./server"
import App from "./App.vue"

let server

beforeEach(() => {
  server = makeServer({ environment: "test" })
})

it("shows the todos from our server", async () => {
  server.create("todo", { id: 1, content: "Learn Mirage JS" })
  server.create("todo", { id: 2, content: "Integrate with Vue.js" })

  const wrapper = mount(App)

  // let’s wait for our vue component to finish loading data
  // we know it’s done when the data-testid enters the dom.
  await waitFor(wrapper, '[data-testid="todo-1"]')
  await waitFor(wrapper, '[data-testid="todo-2"]')

  expect(wrapper.find('[data-testid="todo-1"]').text()).toBe("Learn Mirage JS")
  expect(wrapper.find('[data-testid="todo-2"]').text()).toBe("Integrate with Vue.js")
})

it("shows a message if there are no todo", async () => {
  // Don’t create any todos

  const wrapper = mount(App)
  await waitFor(wrapper, '[data-testid="no-todos"]')

  expect(wrapper.find('[data-testid="no-todos"]').text()).toBe("No todos!")
})

// This helper method returns a promise that resolves
// once the selector enters the wrapper’s dom.
const waitFor = function(wrapper, selector) {
  return new Promise(resolve => {
    const timer = setInterval(() => {
      const todoEl = wrapper.findAll(selector)
      if (todoEl.length > 0) {
        clearInterval(timer)
        resolve()
      }
    }, 100)
  })
}

afterEach(() => {
  server.shutdown()
})

Note: We are using a helper here (as defined in the Mirage JS docs). It returns a promise that allows us to know when the elements we are testing are already in the DOM.

Now run yarn test:unit.

All your tests should pass at this point.

Testing Different Server State With Mirage JS

We could alter our Mirage JS server to test for different server states. Let’s see how.

// src/__tests__/App.spec.js
import { Response } from "miragejs"

First, we import the Response class from Mirage, then we create a new test scenario like so:

it("handles error responses from the server", async () => {
  // Override Mirage’s route handler for /todos, just for this test
  server.get("/todos", () => {
    return new Response(
      500,
      {},
      {
        error: "The database is taking a break.",
      }
    )
  })

  const wrapper = mount(App)

  await waitFor(wrapper, '[data-testid="server-error"]')

  expect(wrapper.find('[data-testid="server-error"]').text()).toBe(
    "The database is taking a break."
  )
})

Run your test and it all should pass.

Conclusion

This article aimed to introduce you to Mirage JS and show you how it makes for a better front-end development experience. We saw the problem Mirage JS created to address (building production-ready front-end without any actual backend API) and how to set it up with Vue.js.

Although this article scratched the surface of what Mirage JS can do, I believe it is enough to get you started.

  • You could go through the docs as well as join the Mirage JS discord server.
  • The supporting repo for this article is available on GitHub.

References

Smashing Editorial (dm, il)