
In this article, I'll explain how I built a dashboard to visualize the traffic data for some documentation I maintain as a technical writer. I have few design skills and limited Python experience, so I needed a simple, low-code approach to show the impact and usage of the documentation I maintain. This turned out to be an open-source solution: Vizro as a template for a low-code dashboard, and Vizro-AI to build individual charts with generative AI.
TL;DR?
If you want to jump right in, you can find the Jupyter Notebook code for the dashboard in my GitHub repo.
Seven Steps To Deploy Kedro Pipelines on Amazon EMR

This post explains how to launch an Amazon EMR cluster and deploy a Kedro project to run a Spark job.
Amazon EMR (previously called Amazon Elastic MapReduce) is a managed cluster platform for applications built using open-source big data frameworks, such as Apache Spark, that process and analyze vast amounts of data with AWS.
How to Build a Serverless WebSockets Platform
When building modern web applications, it is increasingly important to be able to handle real-time data with an event-driven architecture to propagate messages to all connected clients instantly.
Several protocols are available, but WebSocket is arguably the most widely used as it is optimized for minimum overhead and low latency. The WebSocket protocol supports bidirectional, full-duplex communication between client and server over a persistent, single-socket connection. With a WebSocket connection, you can eliminate polling and push updates to a client as soon as an event occurs.
Realtime Challenges for Audience Engagement
What Is Audience Engagement?
A simple example of online audience engagement could be a Livestream with a host and a chat system for audience members to interact with each other in real-time. Other audience engagement solutions include features such as chat or QAs for participants to communicate while sharing an experience, such as a Watch Party, polls, quizzes, and leaderboards.

Device and User Presence
One aspect of audience engagement is the ability to know who’s participating in a virtual event or a user’s “presence”. Closely linked to presence is the user’s state, for essential functionality such as indicators when someone is typing a message into a chat window, or the real-time location of a device.
The Real-time Web: Evolution of the User Experience
Over the last few years, companies have used real-time updates to add new experiences and features and increase their market share.
It's now standard to expect a page within an app or browser to update parts of itself without forcing it to refresh. For example, a news page of live sports scores updates with the latest goal scored, or an app shows a change as you track your taxi on a map.
How Do CRDTs Solve Distributed Data Consistency Challenges?
This is an article about the complexity of maintaining data consistency in distributed environments. It introduces conflict-free replicated data types (CRDTs) as a way to resolve concurrent data changes.
Common Data Consistency Challenges
Consider a situation where there are several distributed entities that each hold a copy of the same data. Data consistency is maintained if those copies continue to match each other, even when one or more of them are updated.
Knowledge Graph Insights Give Investors the Edge
- Global Infrastructure API, the latest proof of concept by Refinitiv Labs, is a global infrastructure database, which links fundamental data and provides an API entry point for queries.
- The prototype leverages knowledge graph insights to interlink different Refinitiv datasets, including bonds, syndicated loans, project finance, Middle East and North Africa (MENA) infrastructure projects, and Belt and Road Initiative (BRI) data.
- Visit the Refinitiv Labs project portfolio to find out how developers, data scientists, and subject-matter experts collaborated to build this customer-focused proof of concept - and many more.
As the ripple effects of the coronavirus are felt across the global economy, affecting manufacturing, supply chains, and the movement of people and goods, capital projects, infrastructure owners, and investors are faced with significant challenges.
These challenges are likely to increase in the months ahead, with infrastructure investment expected to become a key tool for macroeconomic stabilization.
Not Quite Getting Up to Speed
Quantum Supremacy Is Arguable, but We Are Almost There
Last month, I reported on a leaked announcement that Google had proved “quantum supremacy”, which is a concrete illustration of a use case where a quantum computer succeeds in a computation that a classical supercomputer cannot achieve in any reasonable timescale.
Brace Yourself for Quantum Supremacy
Earlier this month, Google’s quantum computing lab seemed to announce that they had proved “quantum supremacy” before the paper was pulled from public view again. This leak was presumably accidental, as the underlying research has been accepted for publication by Nature, but is still under embargo.
You might also like: An Introduction to Quantum Computing
Quantum What?
For the uninitiated, quantum supremacy is the concrete illustration that a quantum computer can complete a computation that a classical supercomputer cannot achieve (or would take prohibitively long to do). In this case, Google’s researchers used a quantum computer with 53 qubits (hold on if you’re unfamiliar with this term, I’ll explain it shortly) to perform a calculation that took three minutes but would take Summit, the world’s most powerful classical supercomputer, 10,000 years to achieve.
Data Science for Decision Makers
Introduction
In this article, I'm interviewing a veteran data scientist, Dr. Stylianos (Stelios) Kampakis, about his career to date and how he helps decision makers across a range of businesses understand how data science can benefit them.

While data science is a field showing immense growth at present, it's somewhat nebulous in its description. I think there's a lot of uncertainty as to exactly what it is and how to apply it. Fortunately, Stelios is an expert data scientist with a mission to educate the public about the power of data science and AI. He is a member of the Royal Statistical Society, an honorary research fellow at the UCL Centre for Blockchain Technologies, and CEO of The Tesseract Academy. A natural polymath, with a Ph.D. in Machine Learning and degrees in Artificial Intelligence, Statistics, Psychology, and Economics, he loves using his broad skillset to solve difficult problems and help companies improve their efficiency.
Big Data in the Renewable Energy Sector
This article is featured in the new DZone Guide to Big Data: Volume, Variety, and Velocity. Get your free copy for insightful articles, industry stats, and more!
In this article, I will look at how big data and AI can be used to improve the efficiency of renewable energy production and offer opportunities for reducing electricity consumption.
NumHub: A Wikipedia for Data
In this interview, I’m talking with Andrey Pyankov, founder of NumHub, which is a community-driven database of numbers, statistics, market research, industry metrics, and financial data. You can find numbers ranging from Google quarterly revenue to M&M's color distribution.
All the information on NumHub is gathered by a community of analysts and researchers, and you can request data be gathered for your research or presentations.
Insights From Developers Working With Augmented Reality and Virtual Reality
In this post, I want to talk a little about the hardware and platforms that developers are targeting for Virtual Reality (VR) and Augmented Reality (AR) apps and games.
At SlashData, their team runs regular surveys of software developers around the world to uncover valuable insights from those working in mobile, desktop, IoT, cloud, web, game, AR/VR, data science, and machine learning.
Virtual Reality: At the Peak of Inflated Expectations?
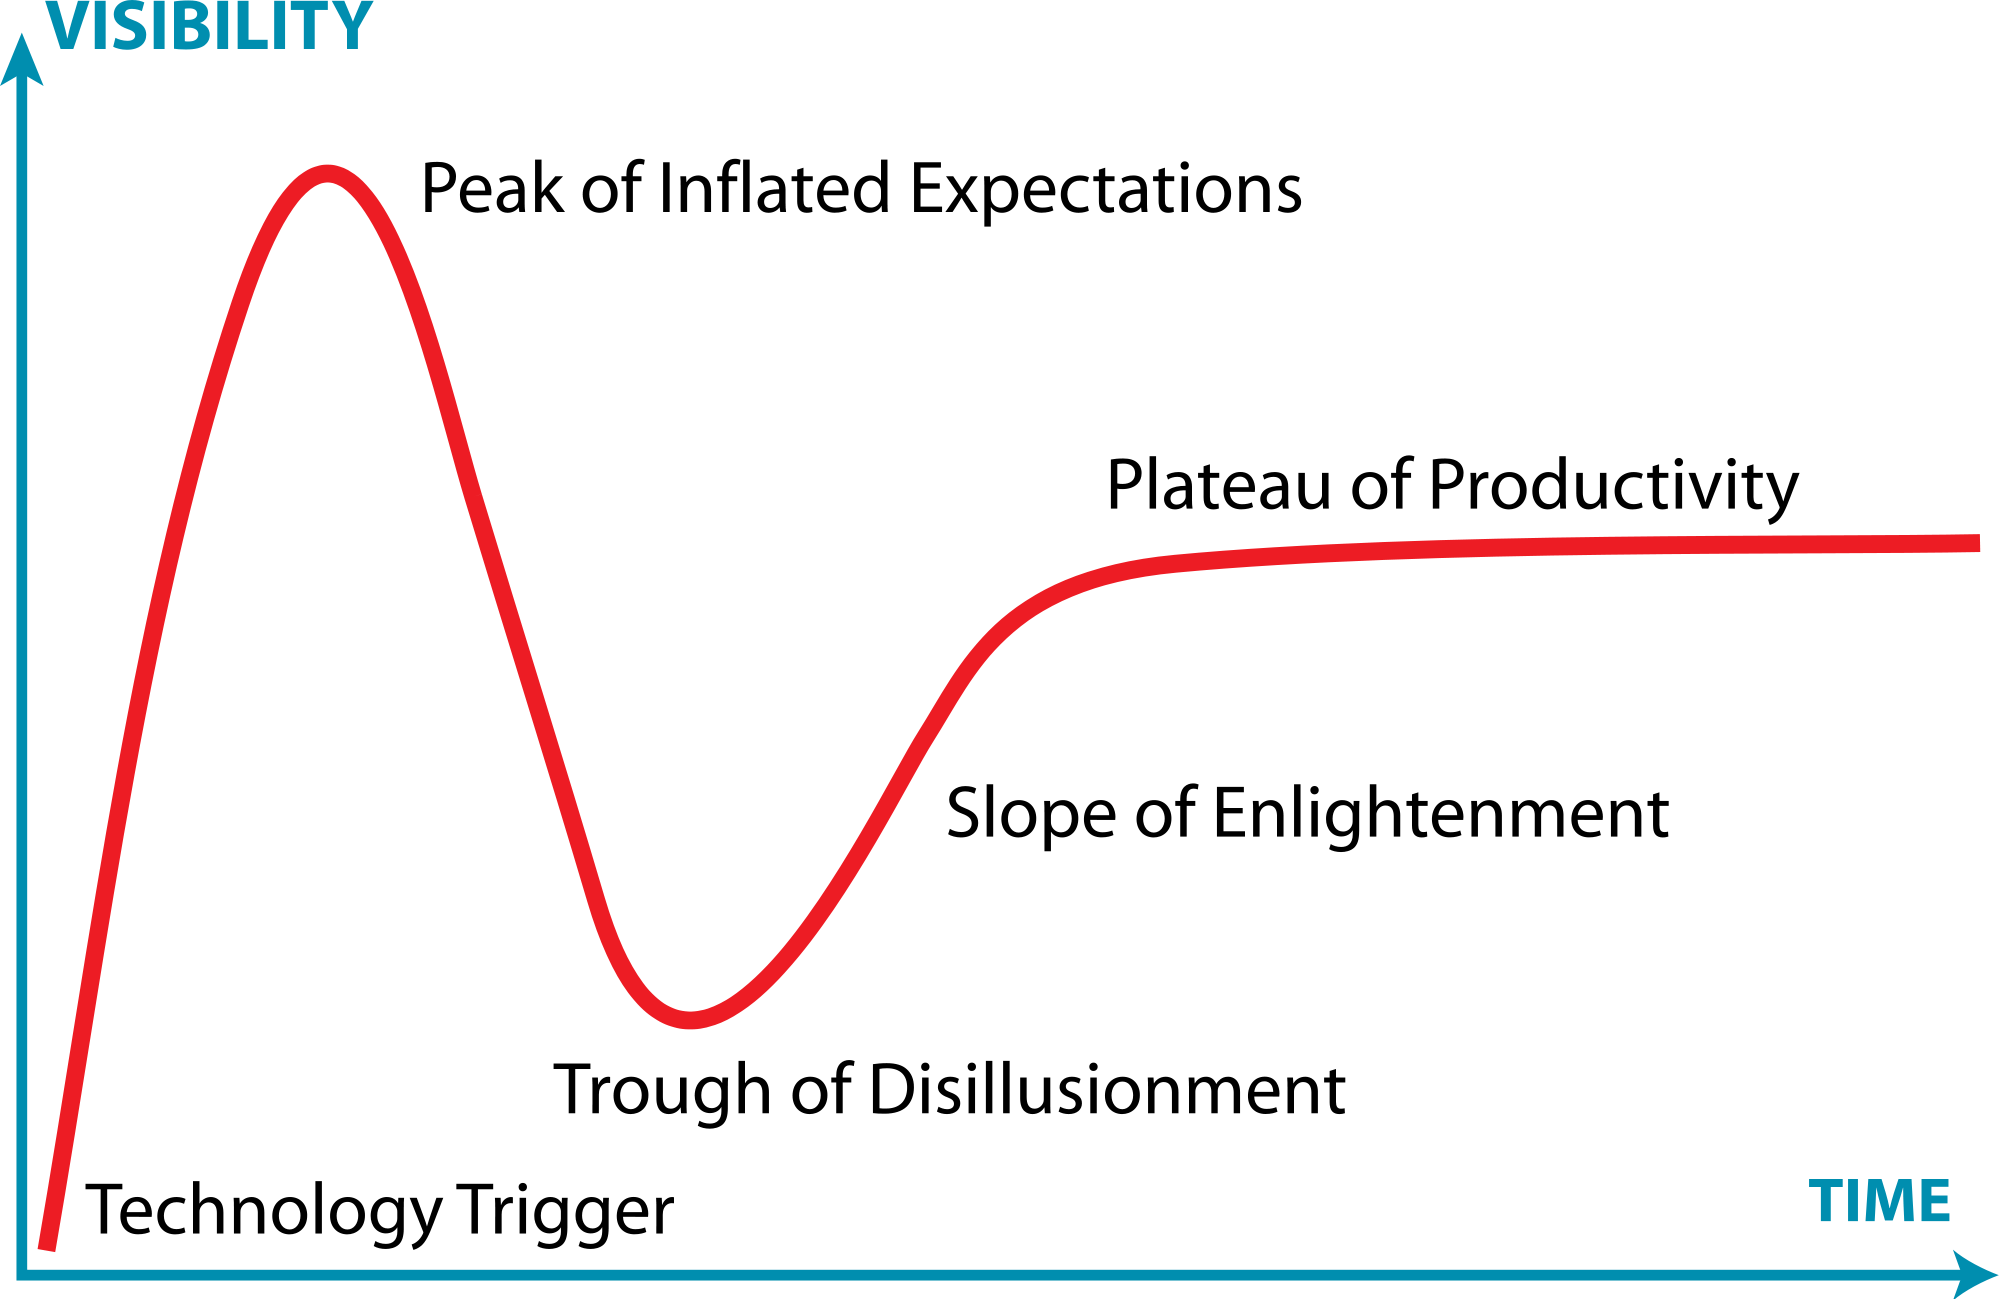
In this article, I’m going to talk about how I perceive the mainstream consumer audience to have rejected virtual reality, and suggest that its child, augmented reality, maybe the Slope of Enlightenment (of the Gartner Hype Cycle) that convinces us to buy in. While these are my views alone, towards the end of the piece, I’ve unearthed some data from software developers around the world who are working with AR and VR. Even if you don’t care about my views, you may find what they have to say interesting. And, if you’d like to express your own thoughts, I’ve included a link to a survey that’s open right now, the results of which will help key players in the industry to draw their own conclusions in 2019.
Tomorrow’s World, Today
I worked in the smartphone industry before it came of age. Our mission was “a smartphone in every pocket” at a time when simple feature phones like the Motorola RAZR were the must-have communications device. Within a few years of our early projects, the competitor, Apple, launched the iPhone. The rest is history. The App Store opened its doors, the stars aligned, the technology dream was realized, and smartphones went on to rule the world.