Continuous Performance Analysis with Lighthouse CI and GitHub Actions

Lighthouse is a free and open-source tool for assessing your website’s performance, accessibility, progressive web app metrics, SEO, and more. The easiest way to use it is through the Chrome DevTools panel. Once you open the DevTools, you will see a “Lighthouse” tab. Clicking the “Generate report” button will run a series of tests on the web page and display the results right there in the Lighthouse tab. This makes it easy to test any web page, whether public or requiring authentication.

If you don’t use Chrome or Chromium-based browsers, like Microsoft Edge or Brave, you can run Lighthouse through its web interface but it only works with publicly available web pages. A Node CLI tool is also provided for those who wish to run Lighthouse audits from the command line.

All the options listed above require some form of manual intervention. Wouldn‘t it be great if we could integrate Lighthouse testing in the continuous integration process so that the impact of our code changes can be displayed inline with each pull request, and so that we can fail the builds if certain performance thresholds are not net? Well, that’s exactly why Lighthouse CI exists!

It is a suite of tools that help you identify the impact of specific code changes on you site not just performance-wise, but in terms of SEO, accessibility, offline support, and other best practices. It’s offers a great way to enforce performance budgets, and also helps you keep track of each reported metric so you can see how they have changed over time.

In this article, we’ll go over how to set up Lighthouse CI and run it locally, then how to get it working as part of a CI workflow through GitHub Actions. Note that Lighthouse CI also works with other CI providers such as Travis CI, GitLab CI, and Circle CI in case you prefer to not to use GitHub Actions.

Setting up the Lighthouse CI locally

In this section, you will configure and run the Lighthouse CI command line tool locally on your machine. Before you proceed, ensure you have Node.js v10 LTS or later and Google Chrome (stable) installed on your machine, then proceed to install the Lighthouse CI tool globally:

$ npm install -g @lhci/cli

Once the CLI has been installed successfully, ru lhci --help to view all the available commands that the tool provides. There are eight commands available at the time of writing.

$ lhci --help
lhci <command> <options>

Commands:
  lhci collect      Run Lighthouse and save the results to a local folder
  lhci upload       Save the results to the server
  lhci assert       Assert that the latest results meet expectations
  lhci autorun      Run collect/assert/upload with sensible defaults
  lhci healthcheck  Run diagnostics to ensure a valid configuration
  lhci open         Opens the HTML reports of collected runs
  lhci wizard       Step-by-step wizard for CI tasks like creating a project
  lhci server       Run Lighthouse CI server

Options:
  --help             Show help  [boolean]
  --version          Show version number  [boolean]
  --no-lighthouserc  Disables automatic usage of a .lighthouserc file.  [boolean]
  --config           Path to JSON config file

At this point, you‘re ready to configure the CLI for your project. The Lighthouse CI configuration can be managed through (in order of increasing precedence) a configuration file, environmental variables, or CLI flags. It uses the Yargs API to read its configuration options, which means there’s a lot of flexibility in how it can be configured. The full documentation covers it all. In this post, we’ll make use of the configuration file option.

Go ahead and create a lighthouserc.js file in the root of your project directory. Make sure the project is being tracked with Git because the Lighthouse CI automatically infers the build context settings from the Git repository. If your project does not use Git, you can control the build context settings through environmental variables instead.

touch lighthouserc.js

Here’s the simplest configuration that will run and collect Lighthouse reports for a static website project, and upload them to temporary public storage.

// lighthouserc.js
module.exports = {
  ci: {
    collect: {
      staticDistDir: './public',
    },
    upload: {
      target: 'temporary-public-storage',
    },
  },
};

The ci.collect object offers several options to control how the Lighthouse CI collects test reports. The staticDistDir option is used to indicate the location of your static HTML files — for example, Hugo builds to a public directory, Jekyll places its build files in a _site directory, and so on. All you need to do is update the staticDistDir option to wherever your build is located. When the Lighthouse CI is run, it will start a server that’s able to run the tests accordingly. Once the test finishes, the server will automatically shut dow.

If your project requires the use of a custom server, you can enter the command used to start the server through the startServerCommand property. When this option is used, you also need to specify the URLs to test against through the url option. This URL should be serveable by the custom server that you specified.

module.exports = {
  ci: {
    collect: {
      startServerCommand: 'npm run server',
      url: ['http://localhost:4000/'],
    },
    upload: {
      target: 'temporary-public-storage',
    },
  },
};

When the Lighthouse CI runs, it executes the server command and watches for the listen or ready string to determine if the server has started. If it does not detect this string after 10 seconds, it assumes the server has started and continues with the test. It then runs Lighthouse three times against each URL in the url array. Once the test has finished running, it shuts down the server process.

You can configure both the pattern string to watch for and timeout duration through the startServerReadyPattern and startServerReadyTimeout options respectively. If you want to change the number of times to run Lighthouse against each URL, use the numberOfRuns property.

// lighthouserc.js
module.exports = {
  ci: {
    collect: {
      startServerCommand: 'npm run server',
      url: ['http://localhost:4000/'],
      startServerReadyPattern: 'Server is running on PORT 4000',
      startServerReadyTimeout: 20000 // milliseconds
      numberOfRuns: 5,
    },
    upload: {
      target: 'temporary-public-storage',
    },
  },
};

The target property inside the ci.upload object is used to configure where Lighthouse CI uploads the results after a test is completed. The temporary-public-storage option indicates that the report will be uploaded to Google’s Cloud Storage and retained for a few days. It will also be available to anyone who has the link, with no authentication required. If you want more control over how the reports are stored, refer to the documentation.

At this point, you should be ready to run the Lighthouse CI tool. Use the command below to start the CLI. It will run Lighthouse thrice against the provided URLs (unless changed via the numberOfRuns option), and upload the median result to the configured target.

lhci autorun

The output should be similar to what is shown below:

✅  .lighthouseci/ directory writable
✅  Configuration file found
✅  Chrome installation found
⚠️   GitHub token not set
Healthcheck passed!

Started a web server on port 52195...
Running Lighthouse 3 time(s) on http://localhost:52195/web-development-with-go/
Run #1...done.
Run #2...done.
Run #3...done.
Running Lighthouse 3 time(s) on http://localhost:52195/custom-html5-video/
Run #1...done.
Run #2...done.
Run #3...done.
Done running Lighthouse!

Uploading median LHR of http://localhost:52195/web-development-with-go/...success!
Open the report at https://storage.googleapis.com/lighthouse-infrastructure.appspot.com/reports/1606403407045-45763.report.html
Uploading median LHR of http://localhost:52195/custom-html5-video/...success!
Open the report at https://storage.googleapis.com/lighthouse-infrastructure.appspot.com/reports/1606403400243-5952.report.html
Saving URL map for GitHub repository ayoisaiah/freshman...success!
No GitHub token set, skipping GitHub status check.

Done running autorun.

The GitHub token message can be ignored for now. We‘ll configure one when it’s time to set up Lighthouse CI with a GitHub action. You can open the Lighthouse report link in your browser to view the median test results for reach URL.

Configuring assertions

Using the Lighthouse CI tool to run and collect Lighthouse reports works well enough, but we can go a step further and configure the tool so that a build fails if the tests results do not match certain criteria. The options that control this behavior can be configured through the assert property. Here’s a snippet showing a sample configuration:

// lighthouserc.js
module.exports = {
  ci: {
    assert: {
      preset: 'lighthouse:no-pwa',
      assertions: {
        'categories:performance': ['error', { minScore: 0.9 }],
        'categories:accessibility': ['warn', { minScore: 0.9 }],
      },
    },
  },
};

The preset option is a quick way to configure Lighthouse assertions. There are three options:

  • lighthouse:all: Asserts that every audit received a perfect score
  • lighthouse:recommended: Asserts that every audit outside performance received a perfect score, and warns when metric values drop below a score of 90
  • lighthouse:no-pwa: The same as lighthouse:recommended but without any of the PWA audits

You can use the assertions object to override or extend the presets, or build a custom set of assertions from scratch. The above configuration asserts a baseline score of 90 for the performance and accessibility categories. The difference is that failure in the former will result in a non-zero exit code while the latter will not. The result of any audit in Lighthouse can be asserted so there’s so much you can do here. Be sure to consult the documentation to discover all of the available options.

You can also configure assertions against a budget.json file. This can be created manually or generated through performancebudget.io. Once you have your file, feed it to the assert object as shown below:

// lighthouserc.js
module.exports = {
  ci: {
    collect: {
      staticDistDir: './public',
      url: ['/'],
    },
    assert: {
      budgetFile: './budget.json',
    },
    upload: {
      target: 'temporary-public-storage',
    },
  },
};

Running Lighthouse CI with GitHub Actions

A useful way to integrate Lighthouse CI into your development workflow is to generate new reports for each commit or pull request to the project’s GitHub repository. This is where GitHub Actions come into play.

To set it up, you need to create a .github/workflow directory at the root of your project. This is where all the workflows for your project will be placed. If you’re new to GitHub Actions, you can think of a workflow as a set of one or more actions to be executed once an event is triggered (such as when a new pull request is made to the repo). Sarah Drasner has a nice primer on using GitHub Actions.

mkdir -p .github/workflow

Next, create a YAML file in the .github/workflow directory. You can name it anything you want as long as it ends with the .yml or .yaml extension. This file is where the workflow configuration for the Lighthouse CI will be placed.

cd .github/workflow
touch lighthouse-ci.yaml

The contents of the lighthouse-ci.yaml file will vary depending on the type of project. I‘ll describe how I set it up for my Hugo website so you can adapt it for other types of projects. Here’s my configuration file in full:

# .github/workflow/lighthouse-ci.yaml
name: Lighthouse
on: [push]
jobs:
  ci:
    runs-on: ubuntu-latest
    steps:
      - name: Checkout code
        uses: actions/checkout@v2
        with:
          token: ${{ secrets.PAT }}
          submodules: recursive

      - name: Setup Hugo
        uses: peaceiris/actions-hugo@v2
        with:
          hugo-version: "0.76.5"
          extended: true

      - name: Build site
        run: hugo

      - name: Use Node.js 15.x
        uses: actions/setup-node@v2
        with:
          node-version: 15.x
      - name: Run the Lighthouse CI
        run: |
          npm install -g @lhci/cli@0.6.x
          lhci autorun

The above configuration creates a workflow called Lighthouse consisting of a single job (ci) which runs on an Ubuntu instance and is triggered whenever code is pushed to any branch in the repository. The job consists of the following steps:

  • Check out the repository that Lighthouse CI will be run against. Hugo uses submodules for its themes, so it’s necessary to ensure all submodules in the repo are checked out as well. If any submodule is in a private repo, you need to create a new Personal Access Token with the repo scope enabled, then add it as a repository secret at https://github.com/<username>/<repo>/settings/secret. Without this token, this step will fail if it encounters a private repo.
  • Install Hugo on the GitHub Action virtual machine so that it can be used to build the site. This Hugo Setup Action is what I used here. You can find other setup actions in the GitHub Actions marketplace.
  • Build the site to a public folder through the hugo command.
  • Install and configure Node.js on the virtual machine through the setup-node action
  • Install the Lighthouse CI tool and execute the lhci autorun command.

Once you’ve set up the config file, you can commit and push the changes to your GitHub repository. This will trigger the workflow you just added provided your configuration was set up correctly. Go to the Actions tab in the project repository to see the status of the workflow under your most recent commit.

If you click through and expand the ci job, you will see the logs for each of the steps in the job. In my case, everything ran successfully but my assertions failed — hence the failure status. Just as we saw when we ran the test locally, the results are uploaded to the temporary public storage and you can view them by clicking the appropriate link in the logs.

Setting up GitHub status checks

At the moment, the Lighthouse CI has been configured to run as soon as code is pushed to the repo whether directly to a branch or through a pull request. The status of the test is displayed on the commit page, but you have click through and expand the logs to see the full details, including the links to the report.

You can set up a GitHub status check so that build reports are displayed directly in the pull request. To set it up, go to the Lighthouse CI GitHub App page, click the “Configure” option, then install and authorize it on your GitHub account or the organization that owns the GitHub repository you want to use. Next, copy the app token provided on the confirmation page and add it to your repository secrets with the name field set to LHCI_GITHUB_APP_TOKEN.

The status check is now ready to use. You can try it out by opening a new pull request or pushing a commit to an already existing pull request.

Historical reporting and comparisons through the Lighthouse CI Server

Using the temporary public storage option to store Lighthouse reports is great way to get started, but it is insufficient if you want to keep your data private or for a longer duration. This is where the Lighthouse CI server can help. It provides a dashboard for exploring historical Lighthouse data and offers an great comparison UI to uncover differences between builds.

To utilize the Lighthouse CI server, you need to deploy it to your own infrastructure. Detailed instructions and recipes for deploying to Heroku and Docker can be found on GitHub.

Conclusion

When setting up your configuration, it is a good idea to include a few different URLs to ensure good test coverage. For a typical blog, you definitely want to include to include the homepage, a post or two which is representative of the type of content on the site, and any other important pages.

Although we didn’t cover the full extent of what the Lighthouse CI tool can do, I hope this article not only helps you get up and running with it, but gives you a good idea of what else it can do. Thanks for reading, and happy coding!


The post Continuous Performance Analysis with Lighthouse CI and GitHub Actions appeared first on CSS-Tricks.

You can support CSS-Tricks by being an MVP Supporter.
Enforcing performance budgets with webpack

As you probably know, a single monolithic JavaScript bundle — once a best practice — is no longer the way to go for modern web applications. Research has shown that larger bundles increase memory usage and CPU costs, especially on mid-range and low-end mobile devices.

webpack has a lot of features to help you achieve smaller bundles and control the loading priority of resources. The most compelling of them is code splitting, which provides a way to split your code into various bundles that can then be loaded on demand or in parallel. Another one is performance hints which indicates when emitted bundle sizes cross a specified threshold at build time so that you can make optimizations or remove unnecessary code.

The default behavior for production builds in webpack is to show a warning when an asset size or entry point is over 250KB (244KiB) in size, but you can configure how performance hints are shown and size thresholds through the performance object in your webpack.config.js file.

Production builds will emit a warning by default for assets over 250KB in size

We will walk through this feature and how to leverage it as a first line of defense against performance regressions.

First, we need to set a custom budget

The default size threshold for assets and entry points (where webpack looks to start building the bundle) may not always fit your requirements, but they can be configured to.

For example, my blog is pretty minimal and my budget size is a modest 50KB (48.8KiB) for both assets and entry points. Here’s the relevant setting in my webpack.config.js:

module.exports = {
  performance: {
    maxAssetSize: 50000,
    maxEntrypointSize: 50000,
  }
};

The maxAssetSize and maxEntrypointSize properties control the threshold sizes for assets and entry points, respectively, and they are both set in bytes. The latter ensures that bundles created from the files listed in the entry object (usually JavaScript or Sass files) do not exceed the specified threshold while the former enforces the same restrictions on other assets emitted by webpack (e.g. images, fonts, etc.).

Let’s show an error if thresholds are exceeded

webpack’s default warning emits when budget thresholds are exceeded. It’s good enough for development environments but insufficient when building for production. We can trigger an error instead by adding the hints property to the performance object and setting it to 'error':

module.exports = {
  performance: {
    maxAssetSize: 50000,
    maxEntrypointSize: 50000,
    hints: 'error',
  }
};
An error is now displayed instead of a warning

There are other valid values for the hints property, including 'warning' and false, where false completely disables warnings, even when the specified limits are encroached. I wouldn’t recommend using false in production mode.

We can exclude certain assets from the budget

webpack enforces size thresholds for every type of asset that it emits. This isn’t always a good thing because an error will be thrown if any of the emitted assets go above the specified limit. For example, if we set webpack to process images, we’ll get an error if just one of them crosses the threshold.

webpack’s performance budgets and asset size limit errors also apply to images

The assetFilter property can be used to control the files used to calculate performance hints:

module.exports = {
  performance: {
    maxAssetSize: 50000,
    maxEntrypointSize: 50000,
    hints: 'error',
    assetFilter: function(assetFilename) {
      return !assetFilename.endsWith('.jpg');
    },
  }
};

This tells webpack to exclude any file that ends with a .jpg extension when it runs the calculations for performance hints. It’s capable of more complex logic to meet all kinds of conditions for environments, file types, and other resources.

The build is now successful but you may need to look for a different way to control your image sizes.

Limitations

While this has been a good working solution for me, a limitation that I’ve come across is that the same budget thresholds are applied to all assets and entry points. In other words, it isn’t yet possible to set multiple budgets as needed, such as different limits for JavaScript, CSS, and image files.

That said, there is an open pull request that should remove this limitation but it is not merged yet. Definitely something to keep an eye on.

Conclusion

It’s so useful to set a performance budget and enforcing one with webpack is something worth considering at the start of any project. It will draw attention to the size of your dependencies and encourage you to look for lighter alternatives where possible to avoid exceeding the budget.

That said, performance budgeting does not end here! Asset size is just one thing of many that affect performance, so there’s still more work to be done to ensure you are delivering an optimal experience. Running a Lighthouse test is a great first step to learn about other metrics you can use as well as suggestions for improvements.

Thanks for reading, and happy coding!


The post Enforcing performance budgets with webpack appeared first on CSS-Tricks.

You can support CSS-Tricks by being an MVP Supporter.

An Introduction to the Picture-in-Picture Web API

Picture-in-Picture made its first appearance on the web in the Safari browser with the release of macOS Sierra in 2016. It made it possible for a user to pop a video out into a small floating window that stays above all others, so that they can keep watching while doing other things. It’s an idea that came from TV, where, for example, you might want to keep watching your Popular Sporting Event even as you browse the guide or even other channels.

Not long after that, Android 8.0 was released which included picture-in-picture support via native APIs. Chrome for Android was able to play videos in picture-in-picture mode through this API even though its desktop counterpart was unable to do so.

This lead to the drafting of a standard Picture-in-Picture Web API which makes it possible for websites to initiate and control this behavior.

At the time of writing, only Chrome (version 70+) and Edge (version 76+) support this feature. Firefox, Safari, and Opera all use proprietary APIs for their implementations.

This browser support data is from Caniuse, which has more detail. A number indicates that browser supports the feature at that version and up.

Desktop

ChromeOperaFirefoxIEEdgeSafari
706472No76TP

Mobile / Tablet

iOS SafariOpera MobileOpera MiniAndroidAndroid ChromeAndroid Firefox
13.3NoNoNo7868

How to use the Picture-In-Picture API

Let's start by adding a video to a webpage.

<video controls src="video.mp4"></video>

In Chrome, there will already be a toggle for entering and exiting Picture-in-Picture mode.

Showing a video with the picture-in-picture option in the bottom right of the screen.

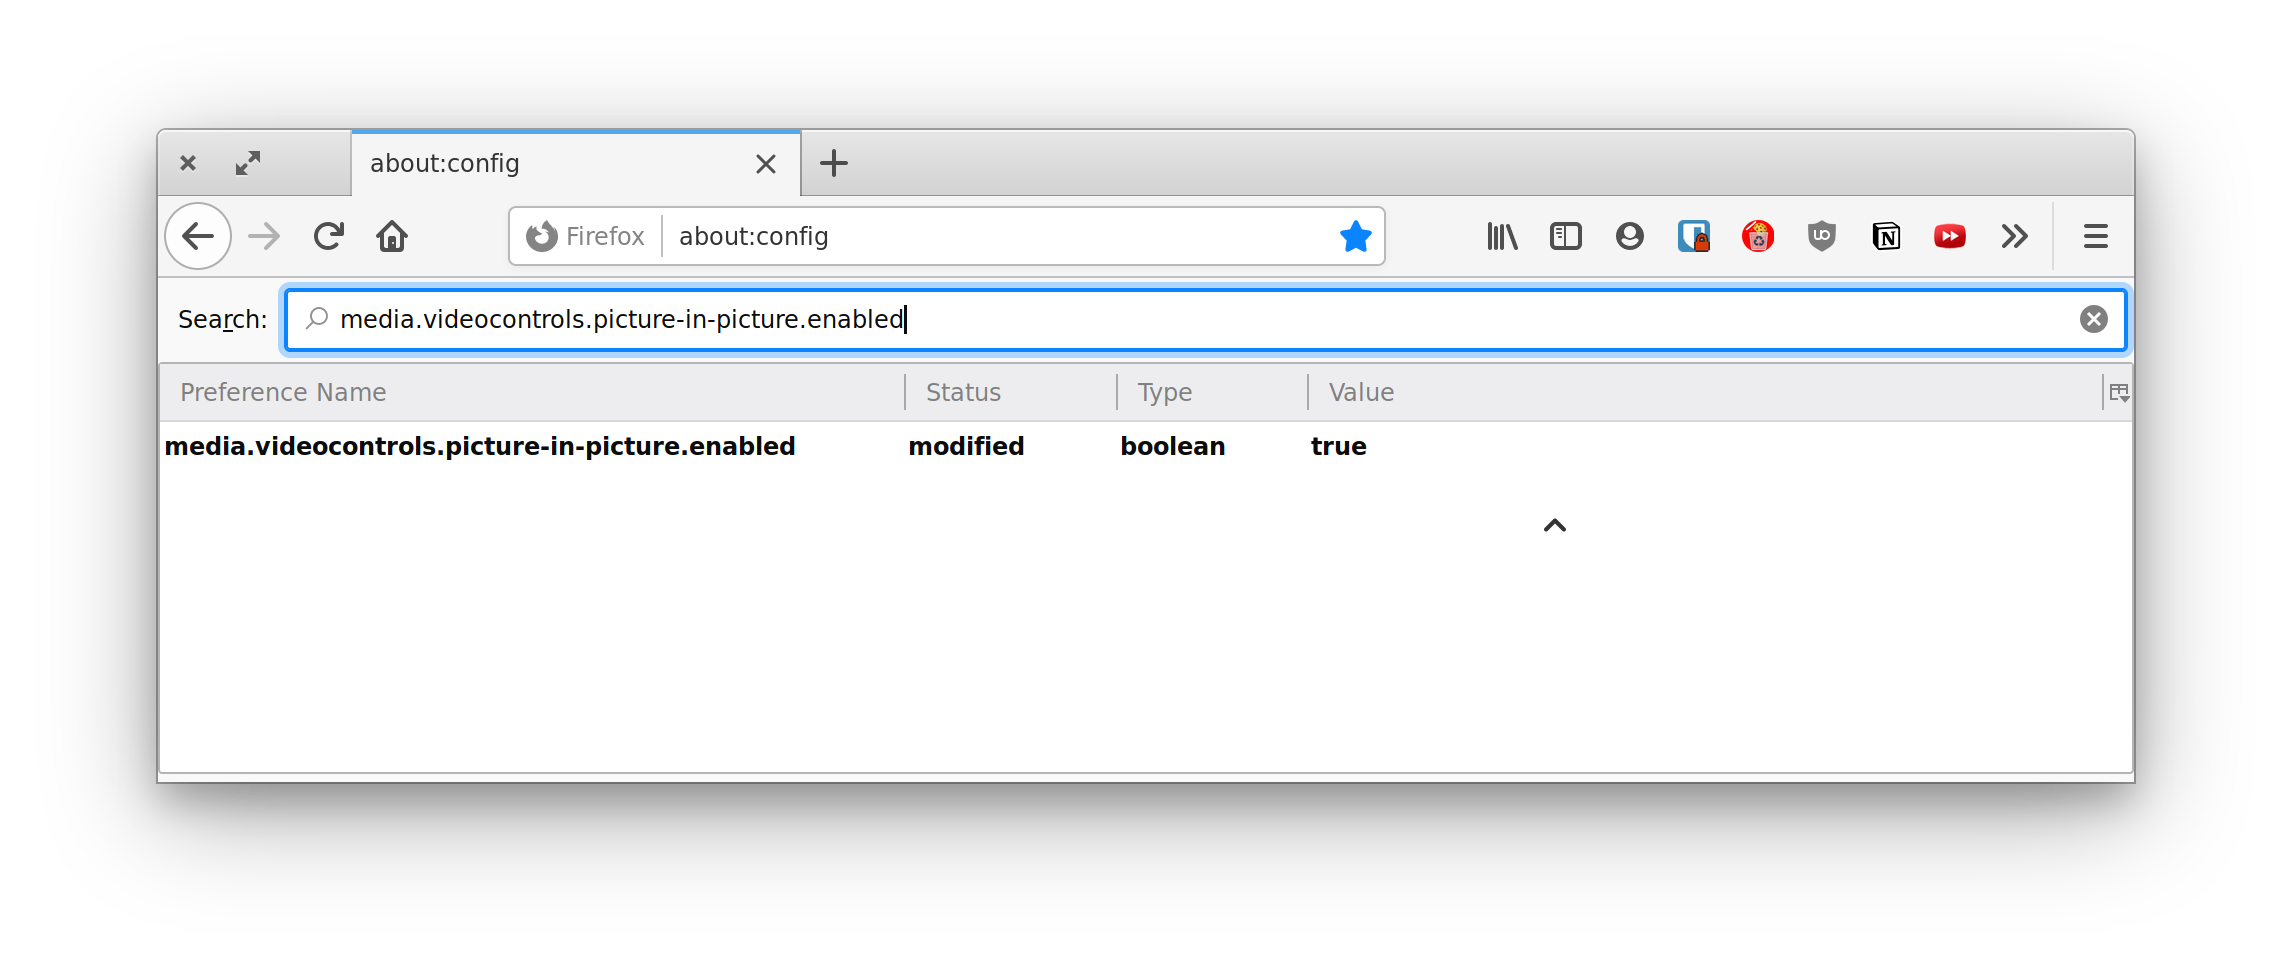
To test Firefox’s implementation, you’ll need to enable the media.videocontrols.picture-in-picture.enabled flag in about:config first, then right-click on the video to find the picture-in-picture option.

Showing the Firefox settings that enable picture-in-picture.

While this works, in many cases, you want your video controls to be consistent across browsers and you might want control over which videos can be entered into picture-in-picture mode and which ones cannot.

We can replace the default method of entering picture-in-picture mode in the browser with our own method using the Picture-in-Picture Web API. For example, let's add a button that, when clicked, enables it:

<button id="pipButton" class="hidden" disabled>Enter Picture-in-Picture mode</button>

Then select both the video and the button in JavaScript:

const video = document.getElementById('video');
const pipButton = document.getElementById('pipButton');

The button is hidden and disabled by default because we need to know if the Picture-in-Picture API is supported and enabled in the user's browser before displaying the it. This is a form of progressive enhancement which helps avoid a broken experience in browsers that do not support the feature.

We can check that the API is supported and enable the button as shown below:

if ('pictureInPictureEnabled' in document) {
  pipButton.classList.remove('hidden')
  pipButton.disabled = false;
}

Entering picture-in-picture mode

Let’s say our JavaScript has determined that the browser has picture-in-picture support enabled. Let's call requestPictureInPicture() on the video element when the button with #pipButton is clicked. This method returns a promise that places the video in a mini window on the bottom-right side of the screen by default when resolved, although it can be moved around by the user.

if ('pictureInPictureEnabled' in document) {
  pipButton.classList.remove('hidden')
  pipButton.disabled = false;

  pipButton.addEventListener('click', () => {
    video.requestPictureInPicture();
  });
}

We cannot leave the code above as is because requestPictureInPicture() returns a promise and it's possible for the promise to reject if, for example, the video metadata is not yet loaded or if the disablePictureInPicture attribute is present on the video.

Let's add a catch block to capture this potential error and let the user know what is going on:

pipButton.addEventListener('click', () => {
  video
    .requestPictureInPicture()
    .catch(error => {
      // Error handling
    });
});

Exiting picture-in-picture mode

The browser helpfully provides a close button on the picture-in-picture window, which enables the window to be close when clicked. However, we can also provide another way to exit picture-in-picture mode as well. For example, we can make clicking our #pipButton close any active picture-in-picture window.

pipButton.addEventListener('click', () => {
  if (document.pictureInPictureElement) {
    document
      .exitPictureInPicture()
      .catch(error => {
      // Error handling
    })
  } else {
    // Request Picture-in-Picture
  }
});

One other situation where you might want to close the picture-in-picture window is when the video enters full-screen mode. Chrome already does this automatically without having to write any code.

Picture-in-Picture events

The browser allows us to detect when a video enters or leaves picture-in-picture mode. Since there are many ways picture-in-picture mode can be entered or exited, it is better to rely on event detection to update media controls.

The events are enterpictureinpicture and leavepictureinpicture which, as their names imply, fire when a video enters or exits picture-in-picture mode, respectively.

In our example, we need to update the #pipButton label depending on whether the video is or is not currently in picture-in-picture mode.

Here's the code that helps us achieve that:

video.addEventListener('enterpictureinpicture', () => {
  pipButton.textContent = 'Exit Picture-in-Picture mode';
});

video.addEventListener('leavepictureinpicture', () => {
  pipButton.textContent = 'Enter Picture-in-Picture mode';
});

Here's a demo of that:

See the Pen
Picture-in-Picture demo
by Ayooluwa (@ayoisaiah)
on CodePen.

Customizing the picture-in-picture window

The browser shows a play/pause button in the picture-in-picture window by default except when the video is playing a MediaStream object (produced by a virtual video source such as a camera, video recording device, screen sharing service, or other hardware sources).

It's also possible to add controls that go to the previous or next track straight from the picture-in-picture window:

navigator.mediaSession.setActionHandler('previoustrack', () => {
  // Go to previous track
});

navigator.mediaSession.setActionHandler('nexttrack', () => {
  // Go to next track
});

Displaying a webcam feed in a picture-in-picture window

Video meeting web applications could benefit from placing a webcam feed in picture-in-picture mode when a user switches back and forth between the app and other browser tabs or windows.

Here's an example:

See the Pen
Display Webcam feed in Picture-in-Picture mode
by Ayooluwa (@ayoisaiah)
on CodePen.

Disabling picture-in-picture on a video

If you do not want a video to pop out in a picture-in-picture window, you can add the disablePictureInPicture attribute to it, like this:

<video disablePictureInPicture controls src="video.mp4>"></video>

Wrapping up

That's pretty much all you need to about the Picture-in-Picture Web API at this time! Currently, the API only supports the <video> element but it is meant to be extensible to other elements as well.

Although browser support is spotty right now, you can still use it as a way to progressively enhance the video experience on your website.

Further reading

The post An Introduction to the Picture-in-Picture Web API appeared first on CSS-Tricks.

How to Use the Web Share API

The Web Share API is one that has seemingly gone under the radar since it was first introduced in Chrome 61 for Android. In essence, it provides a way to trigger the native share dialog of a device (or desktop, if using Safari) when sharing content — say a link or a contact card — directly from a website or web application.

While it’s already possible for a user to share content from a webpage via native means, they have to locate the option in the browser menu, and even then, there’s no control over what gets shared. The introduction of this API allows developers to add sharing functionality into apps or websites by taking advantage of the native content sharing capabilities on a user’s device.

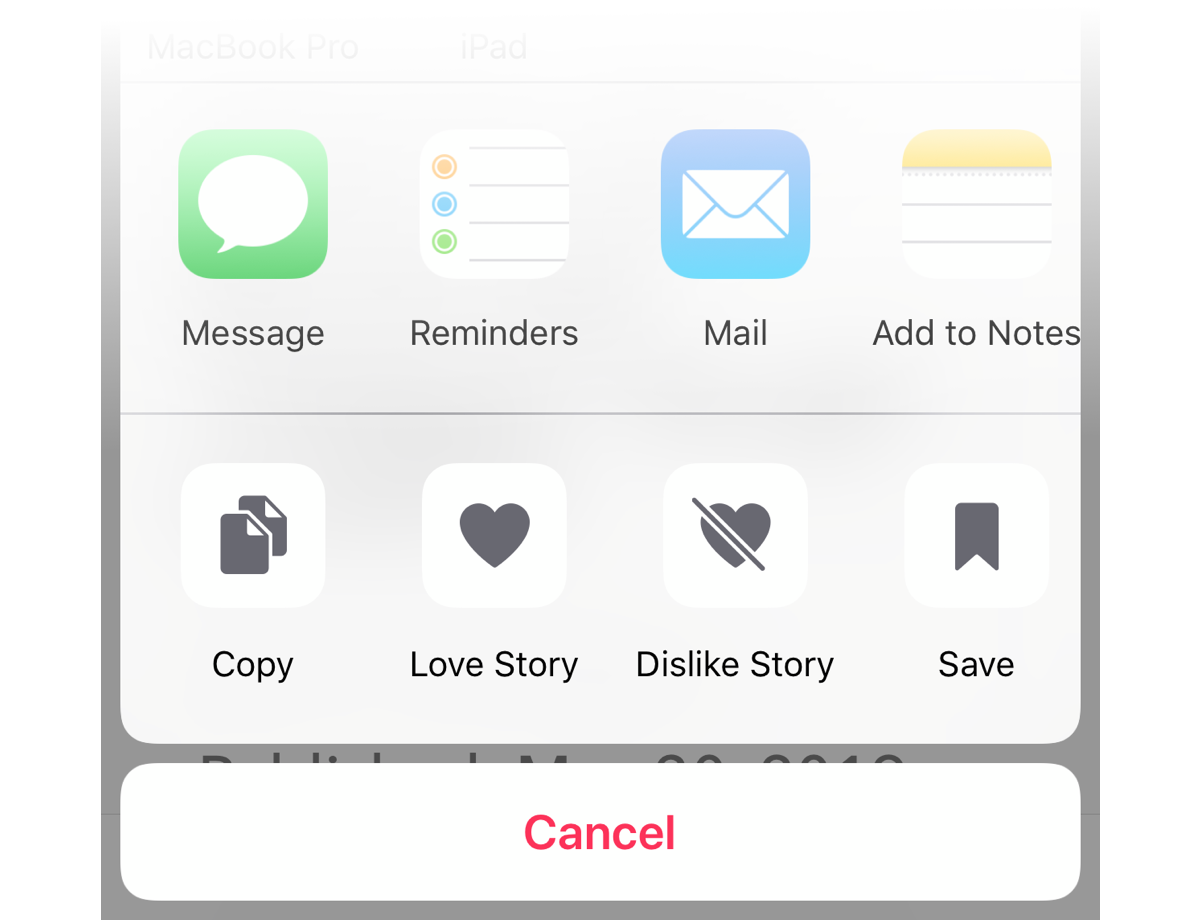
iOS offers a number of native sharing options.

This approach provides a number of advantages over conventional methods:

  • The user is presented with a wide range of options for sharing content compared to the limited number you might have in your DIY implementation.
  • You can improve your page load times by doing away with third-party scripts from individual social platforms.
  • You don’t need to add a series of buttons for different social media sites and email. A single button is sufficient to trigger the device’s native sharing options.
  • Users can customize their preferred share targets on their own device instead of being limited to just the predefined options.

A note on browser support

Before we get into the details of how the API works, let’s get the issue of browser support out of the way. To be honest, browser support isn’t great at this time. It’s only available for Chrome for Android, and Safari (desktop and iOS).

This browser support data is from Caniuse, which has more detail. A number indicates that browser supports the feature at that version and up.

Desktop

ChromeOperaFirefoxIEEdgeSafari
NoNoNoNoNo12.1

Mobile / Tablet

iOS SafariOpera MobileOpera MiniAndroidAndroid ChromeAndroid Firefox
12.2NoNoNo74No

But don’t let that discourage you from adopting this API on your website. It’s pretty easy to implement a fallback for supporting browsers that don’t offer support for it, as you’ll see.

A few requirements for using it

Before you can adopt this API on your own web project, there are two major things to note:

  • Your website has to be served over HTTPS. To facilitate local development, the API also works when your site is running over localhost.
  • To prevent abuse, the API can only be triggered in response to some user action (such as a click event).

Here's an example

To demonstrate how to use this API, I’ve prepared a demo that works essentially the same as it does on my site. Here’s how it looks like:

See the Pen
WebShare API Demo - Start
by Ayooluwa (@ayoisaiah)
on CodePen.

At this moment, once you click the share button, a dialog pops out and shows a few options for sharing the content. Here’s the part of the code that helps us achieve that:

shareButton.addEventListener('click', event => {
  shareDialog.classList.add('is-open');
});

Let’s go ahead and convert this example to use the Web Share API instead. The first thing to do is check if the API is indeed supported on the user’s browser as shown below:

if (navigator.share) {
  // Web Share API is supported
} else {
  // Fallback
}

Using the Web Share API is as simple as calling the navigator.share() method and passing an object that contains at least one of the following fields:

  • url: A string representing the URL to be shared. This will usually be the document URL, but it doesn’t have to be. You share any URL via the Web Share API.
  • title: A string representing the title to be shared, usually document.title.
  • text: Any text you want to include.

Here’s how that looks in practice:

shareButton.addEventListener('click', event => {
  if (navigator.share) {
    navigator.share({
      title: 'WebShare API Demo',
      url: 'https://codepen.io/ayoisaiah/pen/YbNazJ'
    }).then(() => {
      console.log('Thanks for sharing!');
    })
    .catch(console.error);
  } else {
    // fallback
  }
});

At this point, once the share button is clicked in a supported browser, the native picker will pop out with all the possible targets that the user can share the data with. Targets can be social media apps, email, instant messaging, SMS or other registered share targets.

The API is promised-based, so you can attach a .then() method to perhaps display a success message if the share was successful, and handle errors with .catch(). In a real-world scenario, you might want to grab the page’s title and URL using this snippet:

const title = document.title;
const url = document.querySelector('link[rel=canonical]') ? document.querySelector('link[rel=canonical]').href : document.location.href;

For the URL, we first check if the page has a canonical URL and, if so, use that. Otherwise, we grab the href off document.location.

Providing a fallback is a good idea

In browsers where the Web Share API isn’t supported, we need to provide a fallback mechanism so that users on those browsers still get some sharing options.

In our case, we have a dialog that pops out with a few options for sharing the content and the buttons in our demo do not actually link to anywhere since, well, it’s a demo. But if you want to learn about how you can create your own links to share web pages without third-party scripts, Adam Coti's article is a good place to start.

What we want to do is display the fallback dialog for users on browsers without support for the Web Share API. This is as simple as moving the code that opens the share dialog into the else block:

shareButton.addEventListener('click', event => {
  if (navigator.share) {
    navigator.share({
      title: 'WebShare API Demo',
      url: 'https://codepen.io/ayoisaiah/pen/YbNazJ'
    }).then(() => {
      console.log('Thanks for sharing!');
    })
    .catch(console.error);
  } else {
    shareDialog.classList.add('is-open');
  }
});

Now, all users are covered regardless of what browser they’re on. Here's a comparison of how the share button behaves on two mobile browsers, one with Web Share API support, and the other without:

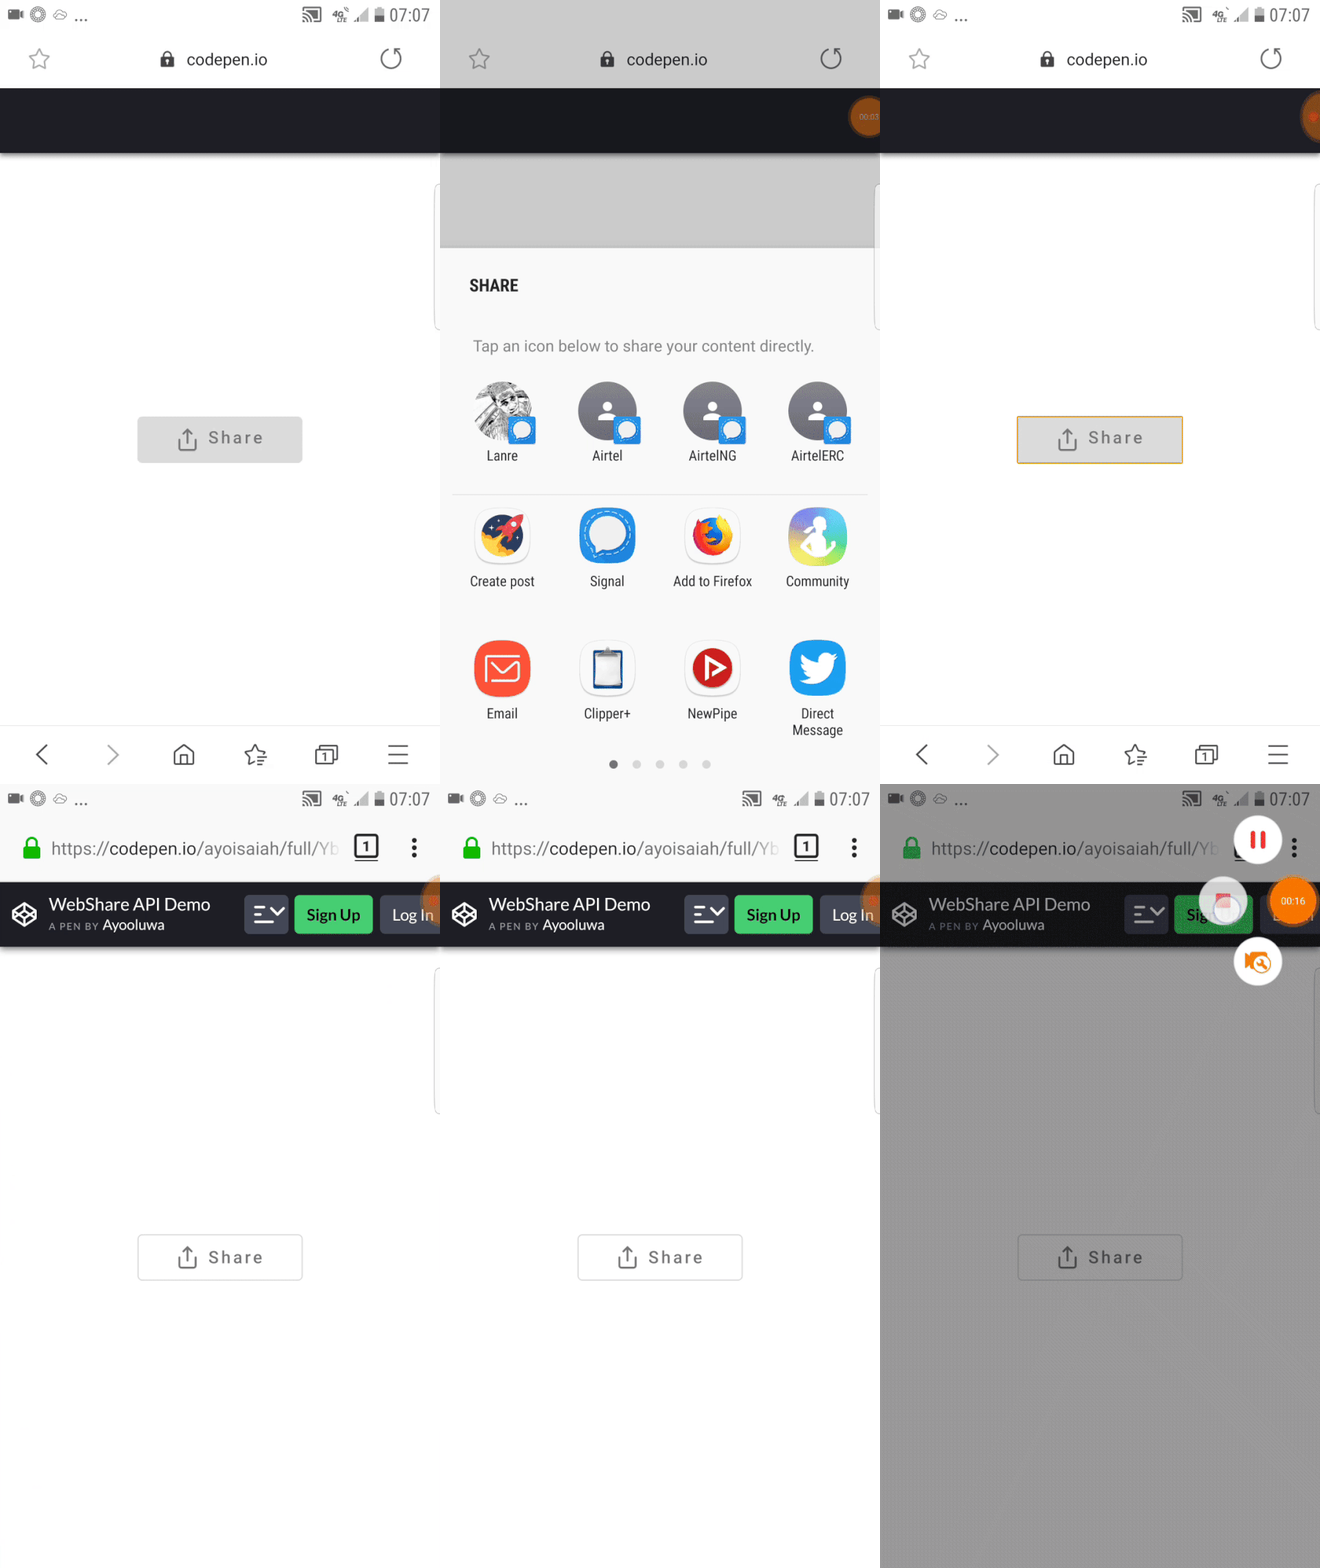
Testing the share button on an Android device that supports the functionality. Android's native sharing options are triggered when the share button is pressed. The second test shows the hare button being clicked on an Android device that does not support the functionality. That produces the fallback sharing options that have been added manually.

Try it out! Use a browser that supports Web Share, and one that doesn't. It should work similarly to the above demonstration.

See the Pen
WebShare API Demo - End
by Ayooluwa (@ayoisaiah)
on CodePen.

Wrapping up

This covers pretty much the baseline for what you need to know about the Web Share API. By implementing it on your website, visitors can share your content more easily across a wider variety of social networks, with contacts and other native apps.

It’s also worth noting that you’re able to add your web application as a share target if it meets the Progressive Web App installation criteria and is added to a user’s home screen. This a feature of the Web Share Target API which you can read about at Google Developers.

Although browser support is spotty, a fallback is easily implemented, so I see no reason why more websites shouldn’t adopt this. If you want to learn more about this API, you can read the specification here.

Have you used the Web Share API? Please share it in the comments.

The post How to Use the Web Share API appeared first on CSS-Tricks.