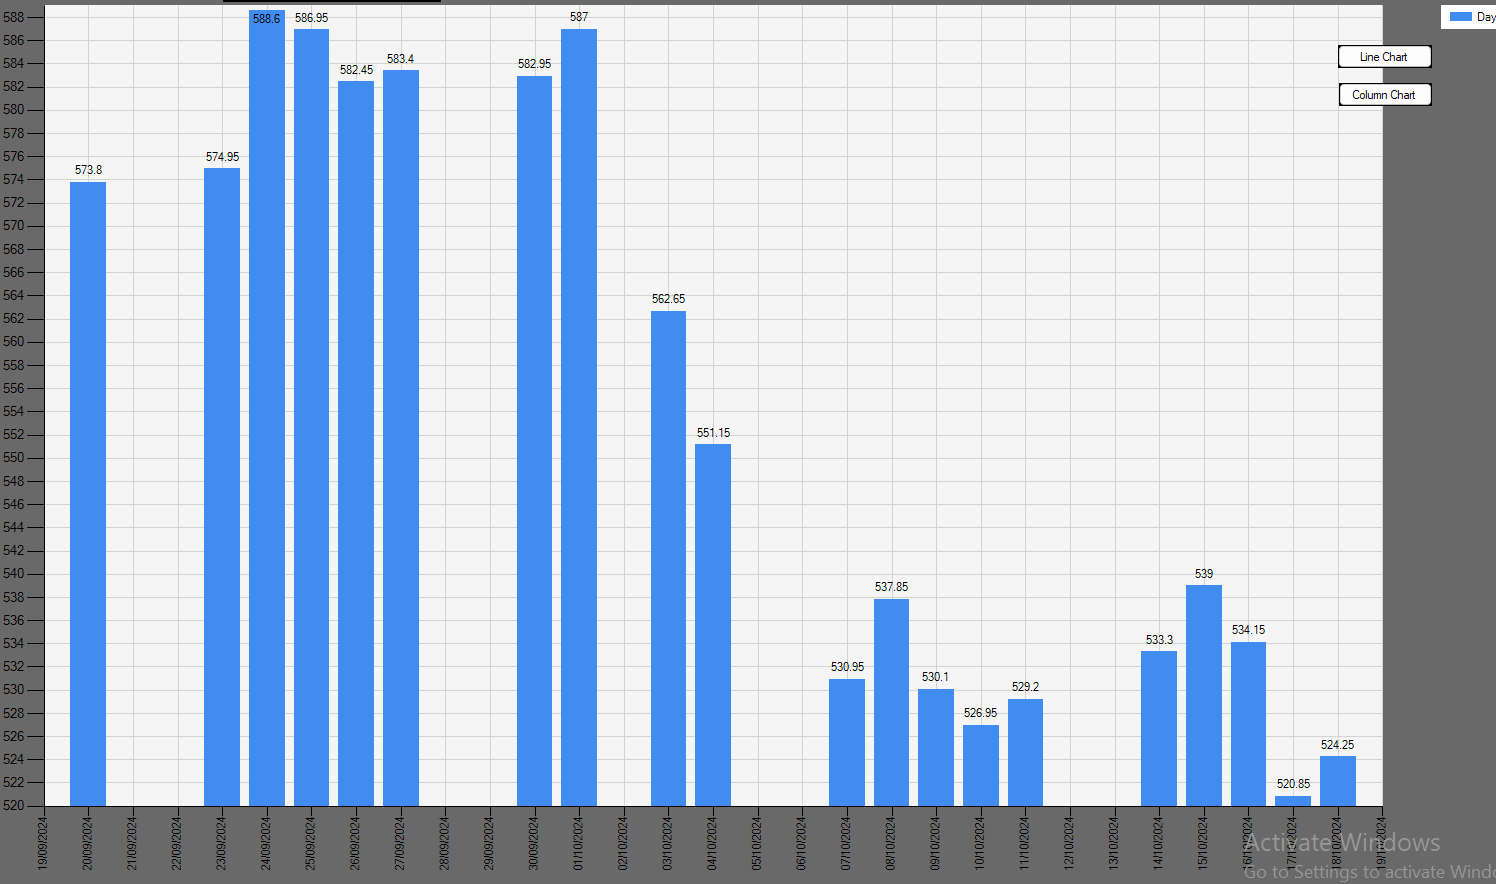
I have chart showing daily closing price of share for last 20 days. There is no closing price for Saturday and Sunday . However chart is showing blank space for these days i.e. total 29 days interval
i do not want blank spaces but only 20 columns. Not getting how to do it.
Chart1.Series(0).Points.Clear()
    'Getting Script Name
    RSData("Select ScriptName from Bse_ScriptMaster where ISIN ='" & V_ISIN & "'")
    DBCnClose()

    If DBCnCommonDataTable.Rows.Count > 0 Then
        Label1.Text = (Trim(DBCnCommonDataTable(0)("ScriptName")))
    End If
    'getting data for the chart
    RSData("select top (20) DAYCLOSE,TIMESTAMP,TOTTRDVAL  from Tbl_Back_Data_Nse where Tbl_Back_Data_Nse.ISIN ='" & V_ISIN & " ' and SERIES ='EQ'  order by TIMESTAMP desc ")
    DBCnClose()
    ' MB(DBCnCommonDataTable.Rows.Count)
    Dim V_Average As Double = 0
    Dim V_15DaysRangeHigh As Double = 0
    Dim V_15DayRangeLow As Double = DBCnCommonDataTable(0)("DAYCLOSE")


    If DBCnCommonDataTable.Rows.Count > 0 Then

        For i = 0 To DBCnCommonDataTable.Rows.Count - 1
            'Price
            If DBCnCommonDataTable(i)("DAYCLOSE") > V_15DaysRangeHigh Then
                V_15DaysRangeHigh = (DBCnCommonDataTable(i)("DAYCLOSE"))

            End If

            If DBCnCommonDataTable(i)("DAYCLOSE") < V_15DayRangeLow Then
                V_15DayRangeLow = (DBCnCommonDataTable(i)("DAYCLOSE"))
            End If

            V_Average = V_Average + (DBCnCommonDataTable(i)("DAYCLOSE"))


        Next

    End If

    Dim V_Low As Integer = CDec(Math.Truncate(V_15DayRangeLow))
    Dim V_High As Integer = CDec(Math.Truncate(V_15DaysRangeHigh)) + 1
    Dim V_Range As Integer = V_High - V_Low

    Chart1.ChartAreas(0).AxisY.Minimum = V_Low
    Chart1.ChartAreas(0).AxisY.Maximum = V_High
    Chart1.ChartAreas(0).AxisX.LabelStyle.Angle = -90
    Chart1.Series("DayClose").BorderWidth = 3

    Chart1.ChartAreas(0).AxisX.MajorGrid.LineColor = Color.LightGray
    Chart1.ChartAreas(0).AxisY.MajorGrid.LineColor = Color.LightGray
    'Chart1.ChartAreas(0).AxisY.Enabled = False

    Dim axis = Chart1.ChartAreas(0).AxisX
    Dim yxis = Chart1.ChartAreas(0).AxisY

    axis.Interval = 1

    If V_Range < 20 Then
        yxis.Interval = 1

    Else

        If V_Range > 40 And V_Range < 80 Then
            yxis.Interval = 2
        Else
            yxis.Interval = CDec(Math.Truncate(V_Range / 40))
        End If

    End If


    If DBCnCommonDataTable.Rows.Count > 0 Then

        Dim Xval As Date
        For i = 0 To DBCnCommonDataTable.Rows.Count - 1

            Chart1.Series("DayClose").Points.AddXY(DBCnCommonDataTable(i)("TIMESTAMP"), MfunIndCurrencyFormat(DBCnCommonDataTable(i)("DAYCLOSE")))

        Next i
    End If

